
Use this to set all the fonts to control the appearance of the text in a graph. All the fonts used in the graph are displayed in a list with a column for each attribute.
- To open this dialog select your graph type from the Graphics menu then select the Options tab and click the Edit all fonts as list button.
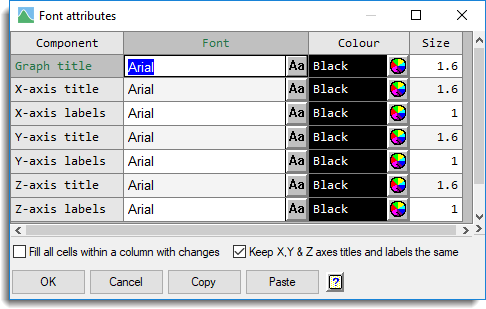
The items for the fonts that can be set are displayed in the rows, and depend on the type of graph, for example, only if it is a 3D graph will the Z-axis title and labels fonts be able to be set. The columns are the Font, Size and Colour and can be set by typing in the values, double clicking the cell to get a list of available choices (but not for Size) or by pasting in entries from the clipboard (Ctrl+C). Multiple cells can be selected for cut or paste using the clipboard selection keys as described below.
The default font and sizes for these are controlled by the current graphics environment which can be set in the Graphics Environment menu.
Selecting cells
You can select cells for copying and pasting by dragging with the mouse from the current cell, or by selecting whole columns by clicking on the column heading. You can also create selections using the Shift key with the cursor movement keys (up-arrow, down-arrow, page up, page down, end and home keys). The left and right arrows move within a cell. Note: Cut (Ctrl+X) does not remove cell items as all cells must have an entry. When pasting cells with a cell selection, the clipboard will be recycled until all the selected cells have been filled,
Entering colours
When a name for a colour is entered within a cell, if it matches a named colour in Genstat, then the colour name will be displayed in the cell, otherwise the RGB value (0 = black, 16777217 = white) will be displayed. You can enter a colour by double clicking the cell or clicking on the colour selector icon at the right of the cell. A colour may also be entered by typing the name or RGB value into the cell. Hex RGB values of the format 0xHHHHHH (H = 0-9, A-F) can also be entered. In this format the first two digits specify the blue component, the next two the green component and the last two digits the red component.
For example, 0xFF0000 will specify blue, 0x00FF00 green and 0x0000FF red. Colour names are not case sensitive and can be automatically filled by only specifying the first letters that uniquely identify the name of a colour. If letters are entered that do not uniquely identify a colour name then the colour with the shortest name will be selected. In the case where there are more than one colour name of the same length the more common colour name will be used. For example, R = red, G = gold (not green as this has more letters), B = blue (not black as this has more letters), W = white (not wheat as white is more common) and P = pink (not plum or Peru as pink is more common). If a colour name does not completely match the start of existing colour, you will be prompted to select the closest matching colour.
Font
This contains the name of the font, displayed in that font (although symbol font names will be displayed in a plain font). You only need enter enough letters for the font to be distinct from other fonts, so Ar would give Arial when the focus moved to a new cell. Clicking the Font button (Aa) or double clicking a font cell will give a list that gives a selection of the fonts available on your computer. Select the font that you want the text to be displayed in.
Colour
This gives the colour of the font. Clicking the colour button in a cell will open a colour palette that lets you select one of the standard colours, or use the Windows colour picker to choose a custom colour.
Size
This is a numeric value that gives the size of the font as a multiplier of the standard Genstat font height. This must a positive number.
Component
The graph components that can have their fonts edited with this dialog are:
Overall title
This controls the title at the top of panel plots like Trellis Plot and Scatter Plot Matrix. The titles for each individual plot within the array of plots is controlled by the Plot title item.
Graph or plot title
This controls the title for an individual plot. The position of the title can be controlled in the Frame options tab. The default settings for this are set in the Graphics Environment Frame tab.
(X/Y/Z) Axis title
This controls the title of the specified axis (X-axis, Y-axis or Z-axis). Where these cannot be set individually (for example in a dot-histogram), there is no axis label (X/Y/Z), and the settings applies to both axes of the plot. The default settings for this are set in the Graphics Environment Axis tab.
(X/Y/Z) Axis labels
This controls the labels of the specified axis (X-axis, Y-axis or Z-axis). Where these cannot be set individually (for example in a dot-histogram), there is no axis label (X/Y/Z), and the settings applies to both axes of the plot. The default settings for this are set in the Graphics Environment Axis tab.
Point labels
This controls the labels plotted with the points in the graph. The size and colour of the points are set in the Line and symbols options for each series of plots plotted, and so these cells are not active.
Fill all cells within a column with changes
When this is selected, each change to a cell is made to all cells in the same column. For example, when this option is selected if you want to draw a graph where each font has the same size, say 2, you could select this item and type 2 in a Size cell, and all cells in the Size column would change to 2.
Keep X & Y (& Z) titles and labels the same
When this is selected, each change to a cell will be made to the same cells belong to the other axes for the graph. For example, with a 3D plot, when this option is selected, if you change an X axis title attribute, the same Y & Z axis title attributes will also be changed to the same value.
Action buttons
| OK | Save the fonts and close the dialog. |
| Cancel | Close the dialog without further changes. |
| Copy | Copy the current or selected cells to the Clipboard. |
| Paste | Paste the Clipboard to list. |
See also
- Edit font window
- Graphics Environment menu
- Graphics tab of Tools | Options where the default font can be set
- Axis options
- Line and Symbols options
- Key tab menu
- Frame options
- DFONT, PEN and DHELP directives