
Factors can be formed from a text or variate by taking sets of values and grouping them into levels. For example, a variate column Age could be put formed into a new factor Age Categories with levels for each 10 year age block (20-29, 30-39, etc.)
- From the menu select Spread | Factor | Calculate.
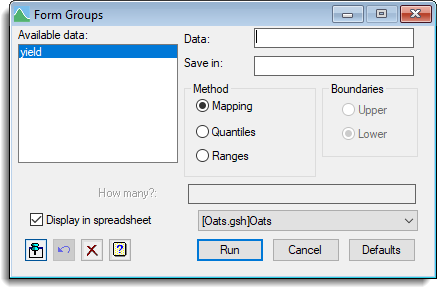
- In the Available data list double-click the name of the text or variate to use.
- To create a new factor column, type a name into the Save in field.
If you leave this blank the original column will be converted to a factor, overwriting the original definition. - Select a method for forming groups from the data. If you select Ranges, select the boundary type then enter each boundary value, separated by a comma.
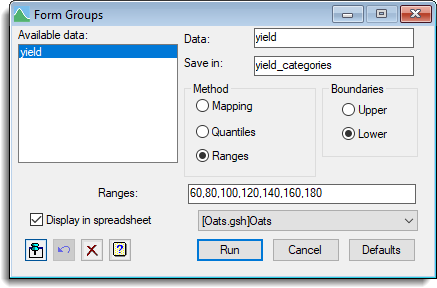
- If you want the factor to appear in a spreadsheet, select one from the dropdown list.
The option New Spreadsheet will put the factor into its own spreadsheet. If you deselect Display in spreadsheet the factor will be added to the central data pool and display in the Data View. - Click Run to form the factor.
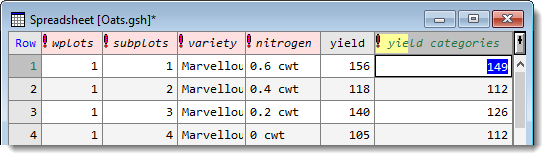
If you selected to display the column in a spreadsheet it will appear with a half-yellow background to indicate that this is a calculated column. You can now edit the factor levels if required, adding meaningful names to each level.
| Save in | Specifies the name of the factor to be formed from the numeric or textual data. If this is left blank, the original variate or text will be converted into a factor, overwriting the original definition. |
| Method | This specifies how the groups are to be formed from the data. Mapping – Forms a group for each distinct value of the variate or text. Quantiles – Divides the range into categories specified by their end-points. Ranges – Computes ranges automatically, to form groups of approximately equal sizes. |
| Boundaries | Specifies whether the boundary values are included at the upper or lower end of each group; e.g. if the Ranges are specified as “1.0 2.0 3.0” the value 2.0 can be assigned to either the group 1.0-2.0 (upper limits) or 2.0-3.0 (lower limits). |
| Ranges | Specifies the boundary values between the groups. To obtain n groups you will need to have n-1 values listed here. |
| How many? | Specifies how many groups are required when using Quantiles. |
| Display in spreadsheet | Lets you display the results in a spreadsheet. You can select the sheet from the list of current open spreadsheets or request a new spreadsheet be created. Note: the number of rows of the spreadsheet must match the length of the results formed by the calculation, otherwise a new sheet will be used. |