
You can change the display attributes for all the selected columns in a single operation.
- First select one or more columns to edit.
- To select several non-adjacent columns hold down Ctrl and click each column header.
- To select several adjacent columns hold down Shift then click the first and last column header in your selection.
- From the menu select Spread | Column | Attributes/Format.
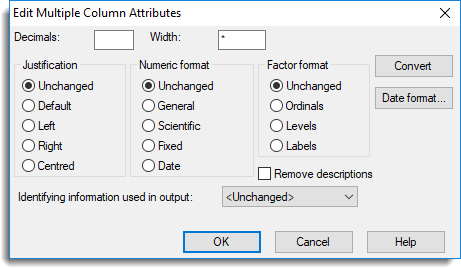
- Select options as required then click OK.
The Unchanged entry specifies that the individual columns will not have that attribute altered.
| Decimals | Specifies the number of decimal places for numeric columns in General, Scientific or Fixed format. The interpretation of decimals depends on the format chosen. For Fixed format it is the number of decimal places and for General and Scientific format it is the number of significant figures to be displayed. |
| Width |
Specifies the width of the column as the number of ‘average characters’. This will be an exact number of characters for fixed-width fonts, but only approximate for proportionally spaced fonts. (Note that you cannot change the font of an individual column or spreadsheet. The default spreadsheet font is set on the Tools | Spreadsheet Options Appearance tab.) |
| Justification | Specifies whether values should be right or left justified or centred. Default justification is left for text and right for numeric data. |
| Numeric format |
Specifies the format used for displaying numeric columns.
You can specify how numbers in date format are displayed by clicking the Date Format button. The default date format applied to a column is set by selecting Tools | Options then clicking the Date Format tab. |
| Factor format | Controls how factors are displayed using ordinals, levels, or labels. Factor values are stored as ordinals which are integers in the range 1,2,…,n, where n is the number of levels of the factor. Factors are displayed using the ordinal values unless levels or labels have been defined. For a detailed description of levels and labels see Understanding Factors and Levels. |
| Remove descriptions |
Controls how factors are displayed using ordinals, levels, or labels. Factor values are stored as ordinals which are integers in the range 1,2,…,n, where n is the number of levels of the factor. Factors are displayed using the ordinal values unless levels or labels have been defined. For a detailed description of levels and labels see Understanding Factors and Levels. |
| Identifying information used in output |
This controls the information that is used to identify data structures in the Output. For data structures that use a whole sheet (e.g. matrices or tables) this must be set on the first column of the spreadsheet containing the data (e.g. not classifying factors for a table or row labels for a matrix). This option has the same effect as using the the IPRINT setting for the data structures directives: VARIATE, TEXT, FACTOR, SCALAR, TABLE, MATRIX, SYMMETRICMATRIX and DIAGONALMATRIX.
|
| Convert | Convert a column to a different type (variate, factor, text or units vector). |
| Date format | Change the date format and base date used to display a column’s values when the numeric format type Date is selected. |