
Use this to specify titles and control settings for the plot of the Kaplan-Meier estimate of the survivor function.
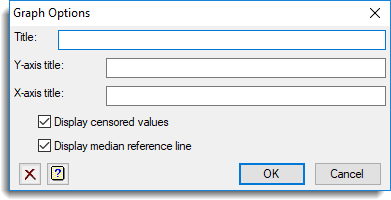
Title
Lets you specify a title for the plot. Quotes are not required.
Y-axis title
Lets you specify a title for the y-axis. Quotes are not required.
X-axis title
Lets you specify a title for the x-axis. Quotes are not required.
Display censored values
When selected, censored values are displayed on the plot at the time points at which they occur.
Display median reference line
When selected, a median reference line is displayed on the graph. This can be used to determine the median survival time.
See also
- Kaplan-Meier (Exact time points)
- KAPLANMEIER procedure in command-mode