Select menu: Stats | Regression Analysis | Linear Models
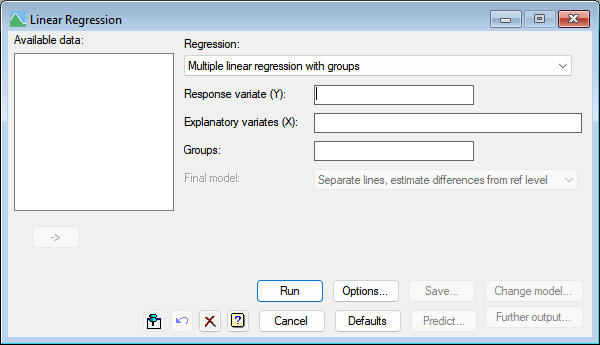
The Multiple linear regression with groups downdown list option fits a sequence of models to data values that are classified into groups.

Response variate
Specifies the name of the response (or y-) variate.
Explanatory variates
Specifies the names of the explanatory (or x-) variate to be fitted. If there is more than one explanatory variate, their names must be separated by spaces or commas. Alternatively, you can select the explanatory variables within the Available data list and click the ![]() button to copy them across.
button to copy them across.
Groups
Specifies a factor defining the different groups.
For an analysis of parallelism the first model to be fitted is an ordinary multiple linear regression, ignoring the groups. Next the model is extended to include a different constant (or intercept) for each group, giving a set of parallel relationships one for each group. Then, the final model has both a different constant and a different regression coefficients (or slope) for the explanatory variates across the different groups. The list adjacent to the Groups field lets you select between the types of regression model that you want to fit.
Final model
For an analysis of parallelism, if the analysis shows that different intercepts are needed but not different slopes, you can use this option to select the final model and re-run the analysis to remove the interaction between the explanatory variates and the groups factor. Similarly, if different intercepts are not needed this option can be used to fit just the explanatory variates.
See also
- Linear Regression for information on general options and other models
- Options for choosing which results to display
- Further Output for additional output subsequent to analysis
- Predictions from Multiple Linear Regression (Grouped)
- Saving Results for further analysis
- Save Individual Regression Terms dialog
- Save regression results in a spreadsheet
- Fitted Model for graphical display of the model
- Model Checking for diagnostic plots for model checking
- Least Significant Intervals Plot Options dialog
- Multiple Comparisons for Predictions options
- Simple Linear Regression
- Simple Linear Regression (with Groups)
- General Linear Regression
- Polynomial Regression
- Smoothing Spline
- Locally Weighted Regression
- Generalized Linear Models menu
- Quantile Regression menu
- Functional Linear Regression menu
- Standard Curves menu for fitting standard non-linear curves
- Circular Regression menu
- MODEL, FIT and ADD directives for fitting regression models with groups using the command language