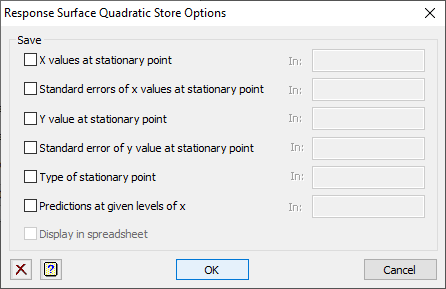
Use this to save results from a Response Surface in Genstat data structures when the Quadratic model is being used. After selecting the appropriate boxes, type the names for the identifiers of the data structures into the corresponding In: fields.

Save
| X values at stationary point | Variate | The x-values at the stationary point for the quadratic model |
| Standard errors of x values at stationary point | Variate | The standard errors of the x-values at stationary point for the quadratic model |
| Y value at stationary point | Scalar | The estimated y-value at the stationary point for the quadratic model |
| Standard error of y value at stationary point | Scalar | The standard error of the y-value at stationary point for the quadratic model |
| Type of stationary point | Scalar | A code that identifies the type of stationary point (2 for maximum, 1 for maximum on a ridge, -2 for minimum, -1 for minimum on a ridge, or 0 for saddle point) |
| Predictions at given levels of x | Matrix | The estimated y-values at the prediction levels for the x-values |
Display in spreadsheet
Select this to display the results in a new spreadsheet windows.
See also
- Response Surface menu
- Response Surface Quadratic Options
- Response Surface Spline Options
- Response Surface Spline Store Options
- RQUADRATIC procedure in command mode