Select menu: Spread | Restrict | Rows Selected from Graph
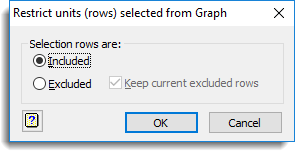
This dialog lets you restrict the rows of a spreadsheet using a selection of points made in a graph. The selected points can be used to include or exclude the rows in the spreadsheet from which they come. If the rows are being excluded, and the sheet already has some excluded rows, then the selected points can be added to the excluded set of rows.
- To select points in a graph, use the Tools | Data Information mode menu (shortcut key Ctrl+D) to turn on Data Information mode (the cursor now displays a question mark).
- Select the points by clicking on them or dragging a selection rectangle or polygon around them (depending on the selection mode chosen in the Graphics Viewer Tool | Options menu on the Data Information tab (note also the Units must be selected for copying here also)).
- Once the required points have been selected, put the selection on the clipboard with the Edit | Copy Data Information menu (shortcut key Ctrl+Shift+D).
Included
Just restrict the rows in the spreadsheet to those corresponding to the points on the clipboard from copying the Data Information selection in the Graphics viewer.
Excluded
Exclude the rows in the spreadsheet corresponding to the points on the clipboard from copying the Data Information selection in the Graphics viewer.
Keep current excluded rows
If the sheet is already restricted, then if this is selected, the selected points from the graph will be added to the excluded rows. If this is not selected, then only the rows associated with the selected points will be excluded, so that the previously excluded rows will be added back into the included set. This option is not available unless the sheet is already restricted.