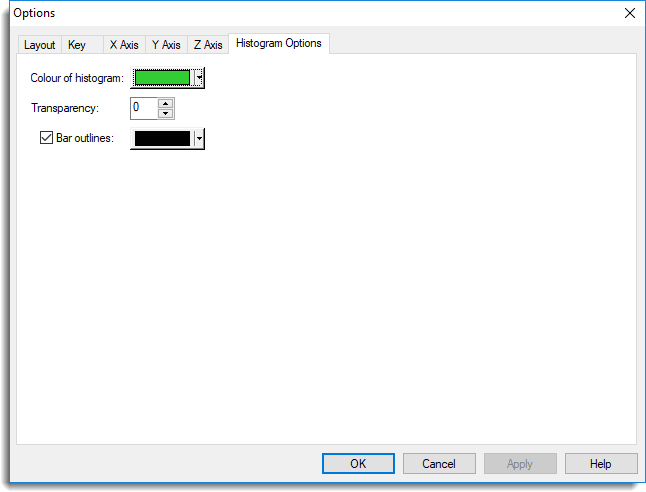
This provides overall control for the histogram.
- Double-click your graph then click the Histogram Options tab.

Colour of histogram
This specifies the base colour and transparency (0 is opaque and 255 is completely transparent) of the histogram. Light and shade are also used to enhance the display.
Bar outlines
Controls whether outlines are drawn around each bar, in the colour specified.