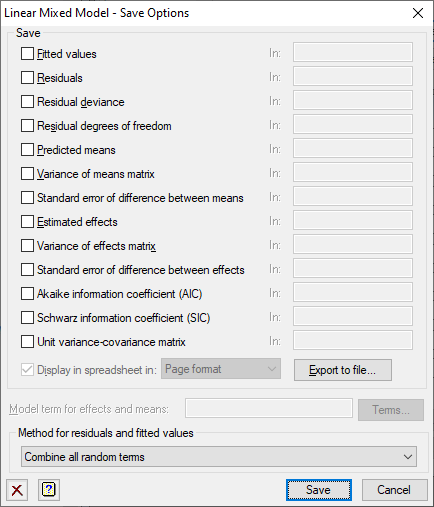
Use this to save results from a REML analysis in Genstat data structures.
- After selecting the appropriate boxes, type the identifiers of the data structures into the corresponding In: fields.

Save
| Fitted values | Variate | Fitted values from the analysis |
| Residuals | Variate | Residuals from the analysis |
| Residual deviance | Scalar | Residual deviance from fitting the full fixed model |
| Residual degrees of freedom | Scalar | Residual degrees of freedom after fitting the full fixed model |
| Predicted means | Table | Predicted means for the specified term |
| Variance matrix of means | Symmetric matrix | Variance-covariance matrix for the predicted means |
| Standard error of difference between means | Symmetric matrix | Standard errors of differences between the predicted means |
| Estimated effects | Table | Estimated regression coefficients for the specified term |
| Variance matrix of effects | Symmetric matrix | Variance-covariance matrix for the estimated effects |
| Standard error of difference between effects | Symmetric matrix | Standard errors of differences between the estimated parameters of each term |
| Akaike information coefficient (AIC) | Scalar | Akaike information coefficient to assess the random model |
| Schwarz information coefficient (SIC) | Scalar | Schwarz information coefficient to assess the random model |
| Unit variance-covariance matrix | Symmetric matrix | Matrix giving the fitted variance-covariance relationship between all the units. Note: this may be very large. This uses the random and residual terms, but not spline terms. It cannot be formed if the model contains sparse inverse covariance matrices. |
Display in spreadsheet
Select this to display the results in a new spreadsheet window. The format of the table of Predicted means and Estimated effects is controlled by the Format drop down list.
| Page format | Each table is displayed on a single page in a separate spreadsheet. The last specified classifying factor indexes the columns in the spreadsheet. |
| Column format | The tables occupy a single column but multiple tables can be put in a single spreadsheet. This is the default for a table with a single classifying factor. |
Export to file
Save selected results into a Genstat or Excel file using the Save REML results in a spreadsheet dialog
Model terms for effects and means
Specifies the model term for which tables of estimated effects and predicted means are to be saved. The string ‘Constant‘ may be used to save results for the constant term. If tables of effects or means are required for more than one model term, this menu should be invoked once for each term, changing the specification of the model term each time.
Method for residuals
The list allows selection from type of residuals that can be calculated.
| Combine all random terms | Use the residuals combined from all random terms. |
| Final random term only | Use the residuals from the final random term. |
| Standardized residuals from all random terms | Uses standardized residuals after combining them from all random terms. |
| Standardized residuals from final random term only | Uses standardized residuals from the final random term. |
| Combine all random terms, excluding spline terms | Use the residuals combined from all random terms except spline terms. |
See also
- Save REML results in a spreadsheet
- Linear Mixed Models (REML) menu
- Options for specifying output options
- Further Output for obtaining additional output
after fitting a model - Residual Plots for generating plots of residuals
- Means Plots for generating plots of one- or two-way tables of means
- REML directive for command mode use of REML, with additional options to
control the algorithm and for more sophisticated analyses - VCOMPONENTS directive for further information about
fixed, random, and spline model terms - Linear Mixed Models (REML) – Correlated Errors for setting up covariance models
- Reml Predictions menu for forming predictions
- VPLOT procedure for plotting residuals
- VFRESIDUALS procedure to calculate standardized residuals