Select menu: Spread | Calculate | Row Summaries
Use this to calculate row summaries within a spreadsheet. Row summaries can be calculated for all variate or factor columns within a spreadsheet.
- After you have imported your data, from the menu select
Spread | Calculate | Row Summaries. - Fill in the fields as required then click OK.
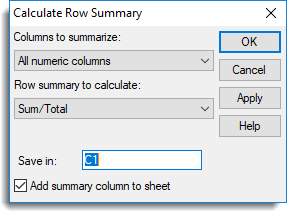
Columns to summarize
Lists the type of columns that can be used in forming the row summaries.
| All numeric columns | All variate and factor columns within the spreadsheet |
| All variate columns | All variate columns within the spreadsheet |
| All factor columns | All factor columns within the spreadsheet |
| Selected columns | The currently selected columns within the spreadsheet. This option is only available when a spreadsheet contains selected columns. |
| Columns in pointer | The columns belonging to a pointer defined within the spreadsheet. This option is only available when a spreadsheet contains pointers. Use the Spread | Sheet | Create pointers menu to define pointers in the spreadsheet. |
Row summary to calculate
The following lists the statistics that can be calculated for each row along with the equivalent function that could be used to perform the same calculation using the CALCULATE directive in the command language.
| Statistic | Description | Genstat Command |
| Sum/Total | The sum/total of the values in the row | VTOTALS/VSUMS function |
| Mean/Average | The mean of the values in the row | VMEANS function |
| Standard deviation | The standard deviation of the values in the row | VSD function |
| Variance | The variance of the values in the row | VVARIANCES function |
| Standard error of Means | The standard error of the row mean | VSEMEANS function |
| Median | The median value in the row | VMEDIANS function |
| Maxima | The maximum value in the row | VMAXIMA function |
| Minima | The minimum value in the row | VMINIMA function |
| Range | The range of the values in the row | VRANGE function |
| No. of Observations | The number of non missing values | VNOBSERVATIONS function |
| Percentile | The percentile of the values in the row (the percentage should be supplied in the space provided) | VPERCENTILES function |
| Quantile | The quantile of values in the row (the probability should be supplied in the space provided) | VQUANTILES function |
| Position | The position of a value in the row (the value to find in each row should be supplied in the space provided. This can be the name of another column in the spreadsheet or a number.) |
VPOSITIONS function |
| No. of Missing Values | The number of missing values (*) | VNMV function |
| No. of Values | The number of columns | VNVALUES function |
| Skewness | The skewness of the values | VSKEWNESS function |
| Kurtosis | The kurtosis of the values | VKURTOSIS function |
Percentage (%) (for summary type Percentile only)
A percentage between 0 and 100% for the calculation of the percentile. Percentages of 0, 25, 50 75, and 100 correspond to the minimum, lower quartile, median, upper quartile and maximum data value respectively.
Probability (for summary type Quantile only)
A probability between 0 and 1 for the calculation of the quantile. Probabilities of 0, 0.25, 0.5, 0.75 and 1 correspond to the minimum, lower quartile, median, upper quartile and maximum data value respectively.
Find value (for summary type Position only)
The value to find in each row. This can be the name of a variate or a number.
Save in
The column name to contain the row summaries.
Add summary column to sheet
Add the calculated column to the current spreadsheet.
Action buttons
| OK | Calculate the column containing the row summaries and close the dialog. |
| Cancel | Close the dialog. |
| Apply | Calculate the column containing the row summaries and leave the dialog open. |
See also
- Spreadsheet Calculate Menu
- CALCULATE directive for calculating row summaries using the command language