Use these options to change the way numbers and dates are displayed on a graph axis.
- To access this dialog select a graph type from the Graphics menu then click one of the axes tabs and click the Format labels button.
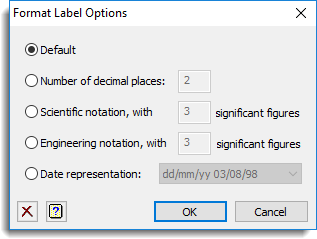
Default
Choose this option to let Genstat decide the number of decimal places used to display axis labels.
Number of decimal places
Choose this option to specify the number of decimal places to use for axis labels.
Scientific notation
Choose this option to use scientific notation (i.e. in the form m × 10n) for axis labels. You can specify the number of significant figures to be used.
Engineering notation
Choose this option to use engineering notation (i.e. in the form m × 10n, in which the exponent of ten, n, must be divisible by three) for axis labels. You can specify the number of significant figures to be used.
Date representation
Choose this option to specify the date format to use for axis labels. You can choose from a list of predefined formats.