Use this to set attributes to control the appearance of a three-dimensional histogram.
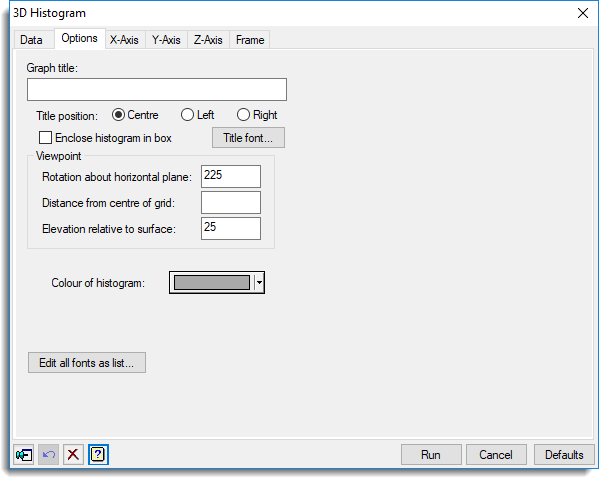
Graph title
Lets you enter a title for the graph. The title appears centred at the top of the graph.
Title position
You can position the title by selecting the Centre, Left or Right option.
Enclose histogram in box
Select this to draw an enclosing box around the graph.
Title font
This opens the Edit Font dialog that lets you control the font for the title.
Viewpoint
Specifies the position of the viewpoint, and thus the orientation of the plot. The default values should usually suffice to display the plot clearly, but if, for example, some parts of the surface are hidden they may be changed to obtain a better view. The Rotation and Elevation values are specified in degrees; the Distance in the same units as the axes, with a default value of 25 times the number of y points in the grid.
Colour of histogram
Provides a list of colours which can be used to draw the histogram. Select the colour you require.
Edit all fonts as a list
Clicking this opens the Edit All Fonts as a List dialog which allows all the fonts in the graph to be set in one place.
Action buttons
| Run | Produce the graph. |
| Cancel | Close the dialog without further changes. |
| Defaults | Reset options to their default settings. |
Action Icons
| Pin | Controls whether to keep the dialog open when you click Run. When the pin is down |
|
| Restore | Restore names into edit fields and default settings. | |
| Clear | Clear all fields and list boxes. | |
| Help | Open the Help topic for this dialog. |
See also
- 3D Histogram data tab menu
- Edit font dialog
- Edit All Fonts as a List
- D3HISTOGRAM directive