- To alter the settings for the Y-axis, double-click your graph then click the Y Axis tab.
Customize the appearance of the axes by changing the various aspects described below.
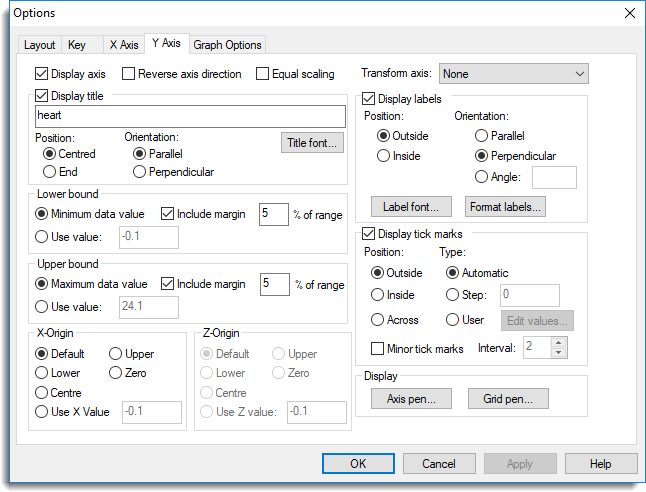
Display axis
You use this option to control whether or not the Y-axis is drawn on the graph.
Reverse axis direction
By selecting this option you reverse the axis scale, so that high values are to the bottom and low values to the top.
Equal scaling
When selected, specifies that the same scaling will be used for each axis.
Transform axis
This provides a list of transformation that can be used to transform the scale of the axis. The tick marks are still defined and labelled according to the original scale, but their physical positions on the graph are transformed. So, for example, using logarithm to base 10, the equal physical distance between 1 and 10 would be the same as the distance between 10 and 100.
Display title
Controls display of a title for the axis. Select this to edit the title text and change options controlling the positioning and title font.
Lower bound
Specifies the lower bound for the axis. This can be set to a specific value or calculated automatically from the data range, using the minimum value with an optional margin. The value given here must be less than the axis upper bound.
Upper bound
Specifies the upper bound for the axis. This can be set to a specific value or calculated automatically from the data range, using the maximum value with an optional margin. The value given here must be greater than the axis lower bound.
X-origin
Specifies the point on the x-axis at which the y-axis should intersect. This can be at the lower or upper bound of the axis (bottom or top of the plot), at zero, or at a specific value (which should be given in the units used for the x-axis).
Z-origin
For a three-dimensional graph, specifies the point on the z-axis at which the y-axis should intersect. This can be at the lower or upper bound of the axis, at zero, or at a specific value (which should be given in the units used for the z-axis).
Display labels
Controls whether to display the scale markings or labels at the axis tick marks. If selected, you can control the appearance of the labels using the Position and Direction radio buttons. For 2D graphs you can specify the angle in degrees to display the labels by selecting the Angle radio button and entering the value in the space provided. You can enter a list which will be cycled if necessary. You can change the font for the labels by clicking on the Label font button and choosing a new font from the available options. For numerical labels you can control the number of decimals displayed by selecting the Format labels option. You can choose to use scientific or engineering notation for axis labels on the Format labels menu. Also if the labels are dates you can use the Format labels option to change the date format.
Display tick marks
Controls whether tick marks are plotted to indicate the scale on the axis. If selected, you have further access to options which allow you to control placement of the ticks. You can allow Genstat to automatically determine a suitable set of tick marks, you can specify the step (or interval) between tick marks, or specify actual tick values. In the first two cases, the ticks will be evenly spaced, but with user-defined tick marks irregular spacing is allowed. The tick marks can be drawn across the axis, towards the outside of the plot or towards the inside.
Minor tick marks are available if you are using automatic tick marks or have specified the step. If selected, the number of sub-intervals must be given and minor tick marks are then generated at appropriate spacing.
Axis pen
This lets you edit attributes of the pen used to draw the axis lines and tick marks.
Grid pen
This lets you edit attributes of the pen used to draw the y-axis grid lines.