Use this to set attributes to control the appearance of the dot histogram.
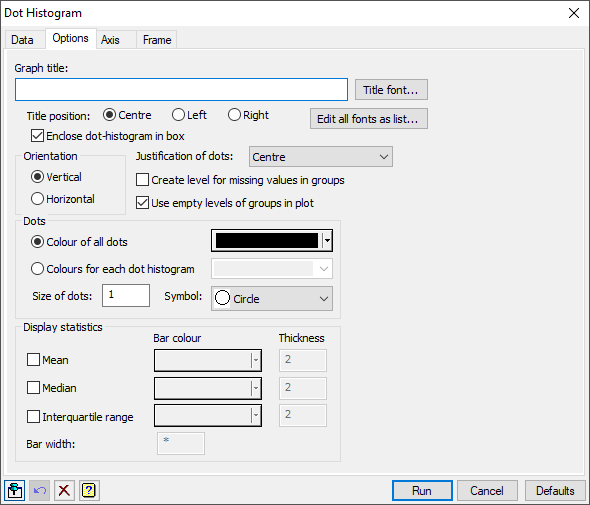
Graph title
Lets you enter a title for the graph. The title appears centred at the top of the graph.
Title font
This opens the Edit Font dialog that lets you control the font for the title.
Title position
You can position the title by selecting the Centre, Left or Right option.
Edit all fonts as a list
Clicking this opens the Edit All Fonts as a List dialog which allows all the fonts in the graph to be set in one place.
Enclose dot-histogram in box
Select this to draw an enclosing box around the dot-histogram.
Orientation
Lets you specify the orientation of the plot.
Justification of dots
Rows of dots in each dot histogram are usually centred on the X-axis (for vertical orientation) but this option gives control over this. The rows of dots can be either centred, right justified, left justified, top justified, bottom justified, or back-to-back to plot adjacent dot histograms back to back.
Create level for missing values for groups
Controls whether any units with missing values in the groups factor are ignored. Select this option to create a level for these missing units.
Use empty levels of groups in plot
Select this to include a null (blank) dot histogram for levels of the groups that are unrepresented in the data.
Dots
Controls the appearance of the dots in the plot.
| Colour of all dots | Provides a list of colours to use for all the dots in the plot |
| Colours of each dot histogram | If multiple dot histograms are drawn on the same graph then a variate, text or factor can be selected to define the colours of each dot histogram. |
| Size | Use this to change the size of the dots. This can alter the number of bins into which the data set is divided. |
| Symbol | Use this to change the symbol used for the dots. |
Display statistics
This displays bars on the histograms showing the location of the selected statistics. Tick a statistic’s check box to include it on the plot. The colour and thickness of the bars for the each statistic is controlled by the Bar colour and Thickness settings alongside it. The thickness must be a positive number and is limited to a maximum value of 10. Click on the Bar colour buttons to obtain a dialog to select a new colour. A statistic must be ticked to enable its colour and thickness controls.
| Mean | Include a bar showing the mean of the data in the plot |
| Median | Include a bar showing the median of the data in the plot |
| Interquartile range | Include two bars showing the lower and upper quartiles of the data in the plot |
The Bar width controls the width of the bars in each plot. If this is left unspecified (*), the width will be made 10% longer than the widest line of dots in each histogram plot. If a number between 0 and 1 is given, the bars will occupy that proportion of the maximum width of the histogram.
Action buttons
| Run | Produce the graph. |
| Cancel | Close the dialog without further changes. |
| Defaults | Reset options to their default settings. |
Action Icons
| Pin | Controls whether to keep the dialog open when you click Run. When the pin is down |
|
| Restore | Restore names into edit fields and default settings. | |
| Clear | Clear all fields and list boxes. | |
| Help | Open the Help topic for this dialog. |
See also
- Dot Histogram data menu
- Edit font dialog
- Edit All Fonts as a List
- DOTHISTOGRAM directive