Lets you generate residual plots following a Hierarchical Generalized Linear Model analysis.
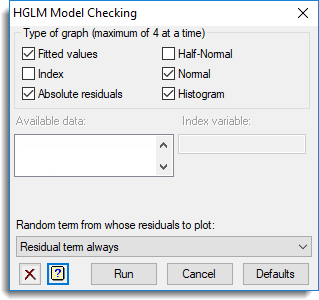
Type of graph
A maximum of four plots can be produced at a time.
| Fitted values | Residuals versus fitted values |
| Index | Plot against an “index” variable (specified by the Index field) . |
| Absolute residuals | Absolute values of residuals versus fitted values |
| Half-normal | Half-Normal plot |
| Normal | Normal plot |
| Histogram | Histogram of residuals |
Index variable
Specifies the variate that is to provide x-values for the index plot. If you leave this space blank then the values 1…n will be used.
Available data
This lists variates that can be used for the Index variable. Double-click on a variate name to copy it to the Index variable field; alternatively, you can type the name directly into the input field.
Random terms from whose residuals are to be plotted
This provides a list of random terms from whose residuals are to be plotted. If you want to use the residuals from the full model then select the Residual term from full model option from the list.
See also
- The HGPLOT procedure in command mode.