This controls options for using Data Information mode in your graphs.
- From the Graphics Viewer menu select Tools | Options then click the Data Information tab.
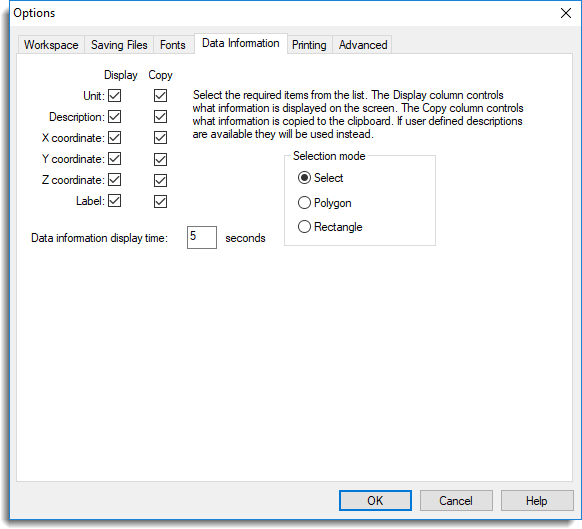
The Display column controls the type of information that is displayed on the screen when in Display Data Information mode.
The Copy column controls the type of information that is copied to the clipboard when the data information is copied to the clipboard.
| Description | The description of the data set containing the selected point. |
| X coordinate | The X coordinate of the selected point. |
| Y coordinate | The Y coordinate of the selected point. |
| Z coordinate | The Z coordinate of the selected point. |
| Label | The label of the selected point. |
| Ordinal | The ordinal or sequence number of the selected point in the containing data set. |
Data information display time
Controls the length of time that data information remains visible when in Display Data Information mode.
Selection mode
Controls how points are selected when in data information mode. The Select option lets you select points by clicking on them and they will then be highlighted in a different colour. Clicking on a point a second time will remove it from the selection. The Polygon option can be used to select one or more points by forming a polygon. To form the polygon, click once at each position where you want a corner, using a right-click to specify the last one. Similarly, the Rectangle option can be used to select points using a rectangle. To do this, click the starting the point and drag the cursor in the direction you want to form the rectangle. Release the mouse button to complete the rectangle.