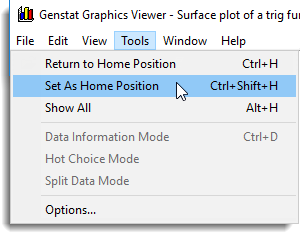
These commands are found on the menu within the Graphics Viewer.
Return To Home Position
Returns the graph to its home position (the initial position if not reset).
Set As Home Position
Sets the current view as the home position for the displayed graph.
Show All
Sets the view so that the entire graphical space is visible. This may include blank space around the graph if a Genstat FRAME statement was used to specify a window occupying less than the full [0,1]x[0,1] square.
This view is the initial default.
Set Centre Point
Allows the user to select a new centre point for the display, thus ensuring that when zooming the chosen point remains in view.
Data Information Mode
Lets you investigate points within a graph. When selected the cursor changes to ![]() Information can then be displayed for any point or line within the graph by moving the cursor onto the point or line of interest. You can toggle the cursor to the data information mode by clicking the
Information can then be displayed for any point or line within the graph by moving the cursor onto the point or line of interest. You can toggle the cursor to the data information mode by clicking the ![]() toolbar button.
toolbar button.
Data information can be copied to the clipboard by clicking on the points whose information is to be copied and then selecting Edit | Copy Data Information or by clicking the ![]() toolbar button. Each point that is selected will be highlighted in a different colour. Clicking on a point a second time will remove it from the selection. The selection of all points can be removed by selecting Edit | Clear Data Selection or by clicking the
toolbar button. Each point that is selected will be highlighted in a different colour. Clicking on a point a second time will remove it from the selection. The selection of all points can be removed by selecting Edit | Clear Data Selection or by clicking the ![]() toolbar button.
toolbar button.
Hot Choice Mode
Lets you toggle visibility of ‘hot’ components in a plot. The cursor will change to ![]() and you can then choose plotted points that have been defined as ‘hot’ to display/hide the associated ‘hot’ components.
and you can then choose plotted points that have been defined as ‘hot’ to display/hide the associated ‘hot’ components.
Split Data Mode
Lets you split a data set into two subsets. In this mode you can choose a subset of a plotted data set using the cursor. When you exit this mode a new data set is created containing the chosen points. The name of the new data set is the same as the original data set but with an apostrophe added to the end. You can then edit the new data set in the Graphics Editor.
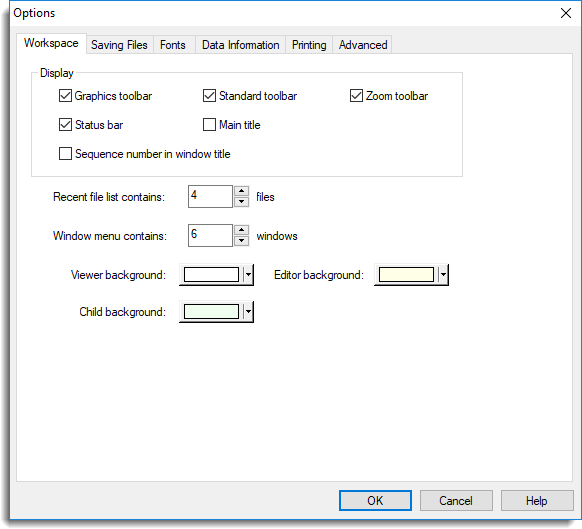
Options
Opens the options property sheet to allow customization of various aspects of the graphical display. See under the following sub-headings for further details: