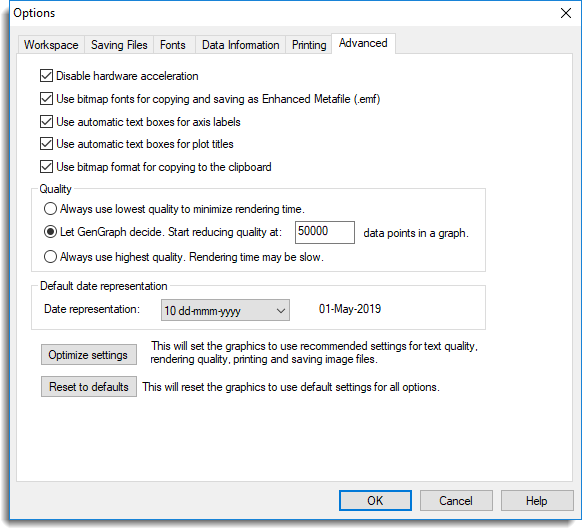
These options are provided to override certain default settings in cases where problems arise because of incompatibilities with Windows, other software or device drivers. We strongly recommend that you do not change these options unless problems occur.
- From the Graphics Viewer menu select Tools | Options then click the Advanced tab.

Disable hardware acceleration
To display its graphical output, Genstat uses the OpenGL system. Many graphics cards provide on-board support for OpenGL, accessed via proprietary device drivers, in order to obtain the best performance. Genstat will try to use any hardware support that is available, but on some occasions problems may arise because of incompatibilities in the device driver. These can usually be corrected by downloading an updated driver (from the graphics card manufacturer’s website). Alternatively, you can disable hardware acceleration, which should result in Genstat selecting a screen mode that uses software OpenGL support.
Symptoms arising from hardware incompatibilities can vary a great deal, from simple problems with colours appearing or disappearing, to unexplained crashes. In the worst case, the Genstat graphics viewer fails during initialisation of the display, so the option is also provided on the main Genstat options menu, on the Graphics tab.
Changes to this setting will not take effect until the Genstat graphics viewer is restarted.
Use bitmap fonts
Genstat graphics provides two kinds of font support: rendered fonts and bitmap fonts. The former are more suitable for on-screen viewing, as they will automatically resize when the image is zoomed in or out, whereas the bitmap fonts usually produce best results when printing or copying graphs.
Disabling bitmap fonts for saving as Enhanced Metafiles (.emf) and copying may help solve specific problems with text alignment or pitch, but usually at the cost of reduced quality and increased file size.
Use automatic text boxes for axis labels
Selecting this option forces axis labels to fit into text boxes. The width of the text boxes is based on the distance between tick marks on the relevant axis. The text boxes can only contain one line of text. Turning off this option may result in axis labels overlapping.
Use automatic text boxes For plot titles
Selecting this option forces the plot title to fit into a text box based on the width of the plot.
Quality
To smooth the appearance of the plot it is rendered several times, each in a slightly different position. By default GenGraph will reduce the number of times the plot is rendered based on the number of data points in the plot. This has the effect of reducing the amount of time taken to render the plot at the expense of a less smooth appearance. You can choose the number of data points at which GenGraph begins to reduce the quality. The quality is reduced further each time the number of data points in a plot exceeds a multiple of the number chosen.
If you experience problems with slow rendering you can turn off this feature by choosing the option Always use lowest quality to minimize rendering time. You can also choose Always use the highest quality but this may result in slow rendering, especially if the plot contains many data points. This only affects on-screen rendering.
Default date representation
This sets the default date representation used by Genstat for axis labels.
Optimize settings
This will set the graphics to use recommended settings for text quality, rendering quality, printing and saving image files. Try using this if you are experiencing problems creating image files or printing. This can cause hardware acceleration to be disabled which will not take effect until the Genstat graphics viewer is restarted.
Reset to defaults
This will set the graphics to use default settings for all options including workspace, data info, saving files, fonts, printing and advanced options. This can cause hardware acceleration to be disabled which will not take effect until the Genstat graphics viewer is restarted.