Use this to save information from a single-stage survey analysis.
Save
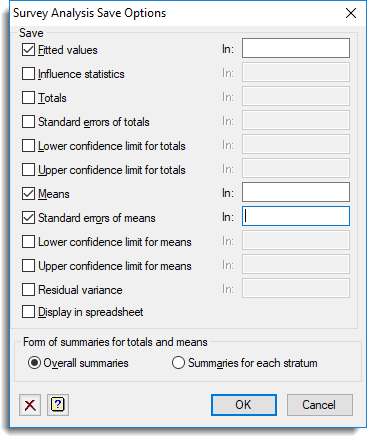
After selecting the appropriate boxes, type names for the data structures into the corresponding In: fields. The table below indicates the type of structures formed for each item.
| Fitted values | Variate | The fitted value (stratum mean) for each unit. |
| Influence statistics | Variate | The influence statistics (these are the percentage change to the grand total if the specified unit was treated as a missing value). |
| Totals | Scalar or Table | Containing the estimates of the stratum totals. |
| Standard errors of totals | Scalar or Table | The standard error of the stratum totals. |
| Lower confidence limit for totals | Scalar or Table | Lower confidence limits of totals. |
| Upper confidence limit for totals | Scalar or Table | Upper confidence limits of totals. |
| Means | Scalar or Table | Containing the estimates of the stratum means. |
| Standard errors of means | Scalar or Table | Containing the standard error of the stratum means. |
| Lower confidence limit for means | Scalar or Table | Lower confidence limits of means. |
| Upper confidence limit for means | Scalar or Table | Upper confidence limits of means. |
| Residual variance | Table | The residual variance within each stratum. |
| Ratios | Table | The estimates of the ratios by stratum (ratio estimation only). |
Display in spreadsheet
Select this to display the results in a new spreadsheet window.
Form of summaries for totals and means
Controls the how the summaries of the means and totals are formed. Select Summaries for each stratum to produce tables for the means and totals with a value for each stratum. Alternatively, select Overall summaries to produce single scalars containing the grand total only.
See also
- Survey analysis menu
- Survey analysis Options
- SVSTRATIFIED procedure