Use this to set various options related to a single stage survey analysis.
Display
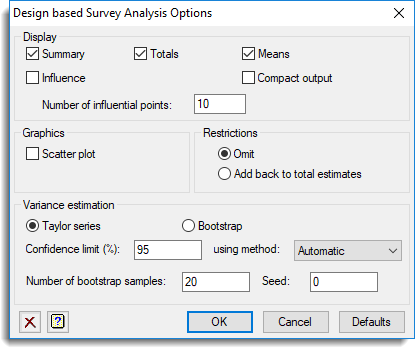
Specifies the output to be displayed.
| Summary | Summary of numbers of units. |
| Totals | Tables of estimated totals and standard errors. |
| Means | Tables of estimated means and standard errors. |
| Influence | List of influential points. The number of points to print is given in the box. |
| Ratios | Line-printer quality plot showing confidence limits for ratios (ratio estimation only). |
| Compact output | This suppresses the display of extra information relating to the analysis, including sums and means of the response data and raising factors (weights). |
Graphics
Specifies the graphs to be displayed.
| Scatter plot | Scatter plot of the response data against stratum number in order to check for outliers where different colours indicate any strata. |
| Graph for each stratum | Separate scatter plots for each stratum. |
Restrictions
Controls how restricted observations are handled in the analysis. Select Omit to exclude restricted observations from the analysis. Alternatively, select Add back to total estimates to excludes them from the initial analysis but then adds them to the total estimates; this is a method for dealing with ‘unrepresentative outliers’, which are considered genuine, but are atypical of the population.
Variance estimation
This controls the method used to estimate the variances:
| Taylor series | Use a Taylor series approximation which is faster but less accurate |
| Bootstrap | Use bootstrap resampling which takes more time |
Confidence limit
This gives the method for forming confidence intervals. The % field specifies the probability level for the confidence intervals. The using method options are:
| Automatic | uses the percentile method when at least 400 bootstrap samples have been used, otherwise it uses the t-distribution method |
| t-distribution | calculates a standard error from the bootstrapped estimates and then uses the t-distribution to form intervals |
| Percentile | uses simple percentiles of the bootstrapped distribution |
Number of bootstrap samples
Number of times to resample the data in forming the bootstrap distribution of the statistics.
Seed
Specifies the seed for the random number generator used to make the permutations; default 0 continues from the previous generation or (if none) initializes the seed automatically from the clock.
Method for ratio estimation
For ratio estimation there are three possible methods. Separate ratios calculates a ratio for each stratum whereas Combined and Classical combined assume a common ratio in all strata. The Classical combined method follows the approach shown in most textbooks where the estimate for a stratum is given by SUM(X)*ratio where the summation is over all units in the stratum. This approach can produce illogical estimates in some situations (e.g. the estimate may be less than the sum of the responses) and so Combined estimates only for the unobserved units and adds this to the sum of the observed responses in the stratum, i.e. (SUM(Y)) + (SUM(X))*ratio, where the summation of Y is over sampled (or responding) units and the summation of X is over unsampled units.
See also
- Survey analysis menu
- Survey analysis Save Options
- SVSTRATIFIED procedure