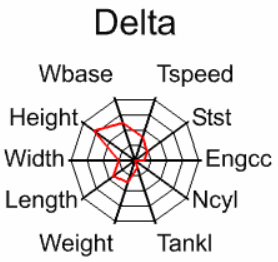
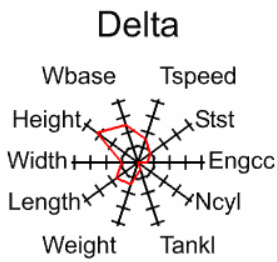
This menu uses the DSPIDERWEB procedure to create spiderweb or star plots. These are used to display multiple variates or groups on radial axes around a centre point. The spiderweb plots connects the axis marks to give a background like a spiderweb, and the star plot does not. The points on each axis for each individual are joined by lines to create a star like configuration. Multiple individuals can be plotted on one plot, and multiple plots and pages can also defined by other classifying factors. The two types of plot using data which are attributes of cars are shown below.
| Spiderweb plot | Star plot |
 |
 |
- From the menu select Graphics | Spiderweb or Star plot.
- Fill in the fields as required then click Run to produce the plot.
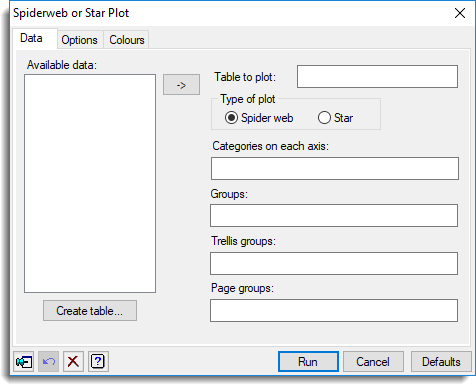
Available data
This lists either the tables that are available for displaying (when Table to plot has focus), or the classifying factors of the table otherwise. Double-clicking an identifier name will copy it into the field with current focus. If the field will only take a single structure (Table to plot or Categories on each axis), the focus will move to the next field. If the field will take multiple structures (Groups, Trellis groups or Page groups), then it will add the structure to the end of the field separating it from the previous entry with a space. You can transfer multiple selections from Available data by holding the Ctrl key on your keyboard while selecting items, then click ![]() to move them all across in one action.
to move them all across in one action.
Type of plot
This controls how the background to the plotted points is displayed.
| Spider | The ticks on the axis are joined with lines creating a spider web. |
| Star | Just tick marks are plotted on each axis. |
Table to plot
This specifies the table whose values are to be plotted. If the classifying factors of the table can be established, only they will be displayed when focus is on one of the groups fields, otherwise all factors will be displayed. If your data are in one or more variates, you can create a table with the Create table button.
Categories on each axis
Specifies the factor to be plotted on the radial axes. There will be an axis for each category of the factor. Corresponding values on each axis are the values in the table at each level of the category factor.
Groups
If there are two or more classifying factors, you can specify factors to use for additional classification on the plot. A different colour is used when plotting lines for the different groups. For multi-way tables, you can supply a list of factors separated by commas or spaces to display the values for each combination of the grouping factors.
Trellis groups
If there are two or more classifying factors, you can specify factors to define a trellis plot where a different plot is produced for each level of the factor. You can supply a list of factors separated by commas or spaces to display a separate plot within a page for each combination of the trellis grouping factors.
Page groups
If there are several treatment factors you can specify factors to define combinations of levels to be plotted on different pages. You can supply a list of factors separated by commas or spaces to display a page for each combination of the page grouping factors.
Create table
This opens a menu which has two options for creating tables.
| Entering the data values into a spreadsheet | This opens the Create Table using Spreadsheet dialog where you can enter values for the table into a spreadsheet. |
| Form a summary table using grouping factors | This opens the Create Table using Groups and Variates dialog where you can choose existing variates and groups and summary statistic to create a table from. |
Using the Multiple Summary Tables menu may give more flexibility in creating the table.
Action buttons
| Run | Produce the plot. |
| Cancel | Close the dialog without further changes. |
| Defaults | Reset options to their default settings. |
Action Icons
| Pin | Controls whether to keep the dialog open when you click Run. When the pin is down |
|
| Restore | Restore names into edit fields and default settings. | |
| Clear | Clear all fields and list boxes. | |
| Help | Open the Help topic for this dialog. |
See also
Options tab for this dialog
Colours tab for this dialog
Create Table using Groups and Variates dialog
Create table using spreadsheet dialog
Multiple Summary Tables dialog
DSPIDERWEB procedure for spider or star plots
DTABLE procedure for plotting tables