Use this to specify variates and factors to be used to create a table for use in the Spiderweb or Star plot dialog.
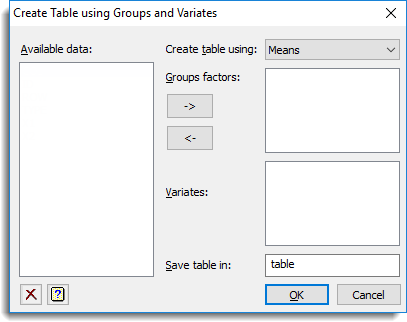
Create table using
This specifies the statistics that are calculated for each group of each variate.
| Statistic | Description | Genstat Command |
| Counts | The number of the values in the group | NVALUES function |
| Totals | The total of the values in the group | SUM function |
| No. of observations | The number of non missing values | NOBSERVATIONS function |
| Means | The mean of the values in the group | MEAN function |
| Medians | The median value in the group | MEDIANS function |
| Variances | The variance of the values in the group | VARIANCE function |
Available data
Lists data structures of the types for the list (Groups factors or Variates) that last had focus. Double-click a name to copy it into the list which last had focus.
Groups factors
This gives the groups that the statistics are to be calculated for each variate. Factor names can be copied to the Groups factors list from the Available data list by double-clicking on the name or by using the ![]() button. Selected items can be removed by clicking the
button. Selected items can be removed by clicking the ![]() button. Note that the maximum number of classifying factors that can be used is 9.
button. Note that the maximum number of classifying factors that can be used is 9.
Variates
This gives the variates that the statistics are to be calculated on. If more than one variate is selected, the variates the statistics come from will form a classifying factor within the table. Variate names can be copied to the Variates list from the Available data list by double-clicking on the name or by using the ![]() button. Selected items can be removed by clicking the
button. Selected items can be removed by clicking the ![]() button.
button.
Save table in
This gives the structure name of the new table to be created.
See also
Spiderweb or Star Plot menu
Spider or Star Plot Options dialog
Multiple Summary Tables
Plot Table
Create table using spreadsheet
Create table using groups
Summary tables menu
Tabbed-tables