Select menu: Graphics | Table
This plots your data in a table. One classifying factor is set as the x-axis, and the rest are assigned to either groups within the plot, between frames in a trellis plot, or between pages.
- After you have imported your data, from the menu select
Graphics | Table. - Fill in the fields as required then click Run.
You can set additional options by clicking the Options tab.
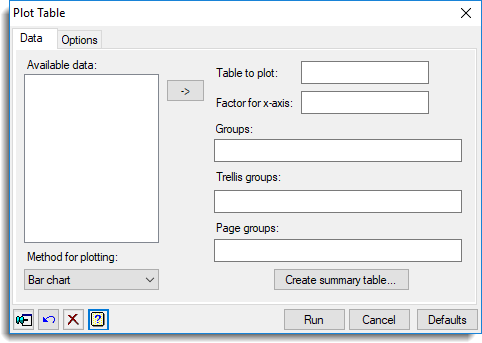
Available data
This lists either the tables that are available for displaying (when Table has focus), or the classifying factors of the table otherwise. Double-clicking an identifier name will copy it into the field with current focus. If the field will only take a single structure (Table or Factor for x-axis), the focus will move to the next field. If the field will take multiple structures (Groups, Trellis groups or Page groups), then it will add the structure to the end of the field separating it from the previous entry with a space. You can transfer multiple selections from Available data by holding the Ctrl key on your keyboard while selecting items, then click ![]() to move them all across in one action.
to move them all across in one action.
Method for plotting
This controls how the values in the table are to be displayed.
| Bar chart | Plots the values as a bar chart |
| Lines | Also plots lines between the values |
| Points | Represents each value by a point |
| Splines | Plots a smooth spline curve though the values |
Table to plot
This specifies the table whose values are to be plotted. If the classifying factors of the table can be established, only they will be displayed when focus is on one of the groups fields, otherwise all factors will be displayed. If your data are in a variate, you can create a table with the Create summary table button. If the table has only a single classifying factor, this will automatically be placed in the Factor for x-axis field and the other group fields will be disabled.
Factor for x-axis
Specifies the factor to be plotted on the x-axis. Corresponding y values are the values in the table at each level of the x-axis factor.
Groups
If there are two or more classifying factors, you can specify factors to use for additional classification on the plot. A different colour is used when plotting means, lines and data for the different groups, according to the choice of Method for plotting. For multi-way tables, you can supply a list of factors separated by commas or spaces to display the values for each combination of the grouping factors.
Trellis groups
If there are two or more classifying factors, you can specify factors to define a trellis plot where a different plot is produced for each level of the factor. You can supply a list of factors separated by commas or spaces to display a separate plot within a page for each combination of the trellis grouping factors.
Page groups
If there are several treatment factors you can specify factors to define combinations of levels to be plotted on different pages. You can supply a list of factors separated by commas or spaces to display a page for each combination of the page grouping factors.
Create summary table
This opens a menu which has two options for creating tables with 1 or 2 classifying factors (as below). For more flexibility, if you need to create a table with 3 or more factors or different summary options, use the Summary Tables or Frequency Tables dialogs.
| Entering the data values into a spreadsheet | This opens the Create Table using Spreadsheet dialog where you can enter values for the table into a spreadsheet. |
| Form a summary table using grouping factors | This opens the Create 1 or 2 way Table using Groups dialog where you can choose an existing variate and summary to create a table from. |
Action buttons
| Run | Produce the means plot. |
| Cancel | Close the dialog without further changes. |
| Defaults | Reset the options to their default settings. |
Action Icons
| Pin | Controls whether to keep the dialog open when you click Run. When the pin is down |
|
| Restore | Restore names into edit fields and default settings. | |
| Clear | Clear all fields and list boxes. | |
| Help | Open the Help topic for this dialog. |
See also
- Options tab for this menu
- Create table using spreadsheet dialog
- Create 1 or 2 way table using groups dialog
- Bar chart
- Mosaic Plot
- Histogram
- Summary Tables menu
- Frequency Tables menu
- DTABLE procedure for plotting tables