
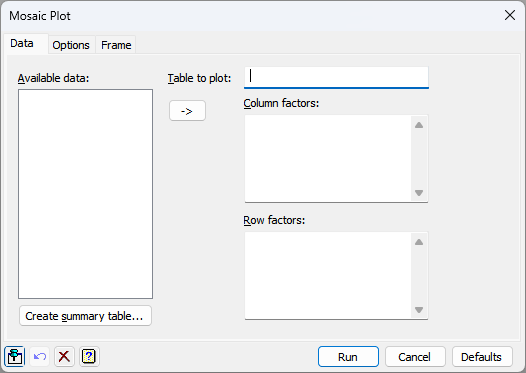
This plots a table of counts as a mosaic plot using the DMOSAIC procedure. The classifying factors are defined as column or row factors, which are displayed across or down the plot respectively. The counts in each cell of the table are displayed as a box whose size is proportional to the counts in that class. The boxes are filled with a colour defined by the final row factor. After selecting a table, its factors can be entered into the Column factors and Row factors fields. The ordering of the factors in these fields defines their hierarchy in the plot, with the first factor changing least often, and so on. If neither is set, the first half (rounded down for an odd number) will be Column factors and the remainder will be Row factors. If only one of Column factors or Row factors is specified, the remaining factors will be assigned to the other. If both are specified, then all the factors in the table must be assigned to one or other, so that the Available data list is empty. Where default lists are used, they will be in the order of the CLASSIFICATION option of the TABULATE or TABLE directives that created the table.
Available data
When Table to plot has focus, this lists the tables that are available. Otherwise it lists the classifying factors of the selected table. Double-clicking an identifier name will copy it into the field with current focus. The Table to plot field takes a single structure, so the focus moves afterwards to the Column factors field. The Column factors and Row factors fields can take multiple factors. You can transfer multiple selections from the list by holding the Ctrl key on your keyboard while selecting items, and then clicking the button to move them all across in one action. As each factor can be used only once, factors are removed from the list after they have been transferred. If you remove a factor from a factor field, it will reappear in this list.
Table to plot
This specifies the table whose values are to be plotted. If the classifying factors of the table can be established, only they will be displayed when focus is on one of the factors fields. Otherwise all factors will be displayed. Tables for mosaic plots must have between 2 and 8 classifying factors. If your data have not yet been tabulated, you can create a table with the Create summary table button.
Column factors
Specifies the factors to be plotted across the plot. You can edit this list manually to remove or type in factors. When focus is set to this field, the Available data list will display the factors of the table that have not yet been assigned to the row or column factors fields. There must be at least one, but no more than four, column factors.
Row factors
Specifies the factors to be plotted down the plot. The last factor in this list will be used to colour the boxes. You can edit this list manually to remove or type in factors. When focus is set to this field, the Available data list will display factors of the table that have not yet been assigned to the row or column factors fields. There must be at least one, but no more than four, row factors.
Create summary table
This opens the Frequency Tables menu to allow you to create new tables of counts. When the Frequency Tables menu is opened by using this button, any table that it creates will be entered automatically into the Table to plot field. Moving to another tab of the menu (Options or Frame) disables this automatic link.
Action buttons
| Run | Produce the means plot. |
| Cancel | Close the menu without further changes. |
| Defaults | Reset the options to their default settings. |
Action Icons
| Pin | Controls whether to keep the dialog open when you click Run. When the pin is down |
|
| Restore | Restore names into edit fields and default settings. | |
| Clear | Clear all fields and list boxes. | |
| Help | Open the Help topic for this dialog. |
See also
- Mosaic Plot – Options tab for this menu
- Frame options
- Text Sizes and Fonts options
- Edit font dialog
- Bar chart
- Histogram
- Frequency Tables menu
- Summary Tables menu
- DMOSAIC procedure
- TABULATE directive
- TABLE directive