Select menu: Stats | Summary Statistics | Summary Tables
This dialog produces summaries of data values classified into different groups. You can save tables of results by clicking Store and specifying the names, then clicking Run.
- After you have imported your data, from the menu select
Stats | Summary Statistics | Summary Tables.
OR
Stats | Survey Analysis | Summary Tables. - Fill in the fields as required then click Run.
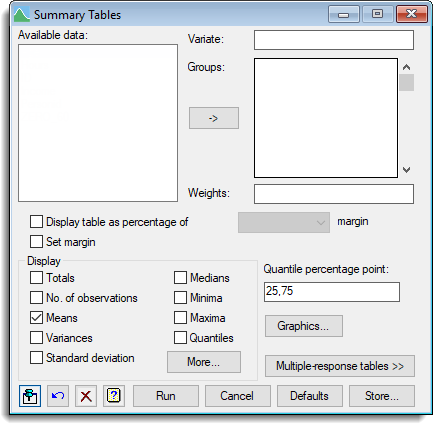
Available data
This lists data structures appropriate to the current input field. The contents will change as you move from one field to the next, displaying either variates or factors. Double-click a name to copy it to the current input field or type the name.
Variate
Specifies a variate containing the data values.
Groups
The groups are specified by one or more factors, each of which must have the same length as the data variate. You can transfer multiple selections from Available data by holding the Ctrl key on your keyboard while selecting items, then click ![]() to move them all across in one action.
to move them all across in one action.
Weights
A variate specifying weights to be used in the tabulation.
Display table as percentage of margin
This allows the body of the table to be expressed as percentages of the corresponding values of the selected margin. The margin to be used as the denominator can be chosen by selecting the required factor from the dropdown list.
Set margin
Specifies whether the tables should include margins (summaries over all levels of each factor).
Display
Select the statistics that you want to produce.
| Totals | Totals of values within groups |
| No. of observations | Number of observations within each group |
| Means | Mean of the sample for each group |
| Variances | Variance of the sample for each group |
| Standard deviation | Standard deviation of the sample for each group |
| Median | Median value that divides each grouped sample into two equally sized sets |
| Minimum | Minimum value in sample |
| Maxima | Maximum value in sample |
| Quantiles | Specify the quantiles required within the Quantile percentage point field. |
More summary statistics such as standard error of the mean, skewness, and kurtosis can be selected by clicking on the More button.
Quantile percentage point
Specifies a list of percentage points for which quantiles will be calculated. You can also supply the name of a variate containing the required values.
Graphics
Opens a dialog which can be used to plot the table currently specified by the factors in the Graphics list.
Multiple-response tables
Displays two additional options for producing summaries of tables classified by multiple-response factors.
Pointers to factors defining multiple responses
A pointer to factors defining multiple responses in the table. You can form a pointer to factors for a multiple-response table using the form multiple-response factors menu.
Names for factors to index multiple-responses
Genstat generates an ordinary factor to classify each dimension of the table corresponding to multiple responses. You can specify names for these factors in the space provided.
Action buttons
| Run | Run tabulation of groups. |
| Cancel | Close the dialog without further changes. |
| Defaults | Reset options to the default settings. Clicking the right mouse on this button produces a shortcut menu where you can choose to set the options using the currently stored defaults or the Genstat default settings. |
| Store | Opens a dialog to specify names of structures to store the results from the tabulation. The names to save the structures should be supplied before running the tabulation. |
Action Icons
| Pin | Controls whether to keep the dialog open when you click Run. When the pin is down |
|
| Restore | Restore names into edit fields and default settings. | |
| Clear | Clear all fields and list boxes. | |
| Help | Open the Help topic for this dialog. |
See also
- Options for displaying more summary statistics of grouped data
- Saving summaries of grouped data
- Multiple Summary Tables menu
- Frequency tables menu
- Form multiple-response factors menu
- Summary statistics menu
- The Graphics menu for histograms, boxplots, dotplot, rugplots, and Stem and Leaf on the Summary statistics menu for additional graphical summaries of data.
- Chi-square goodness of fit
- Tabbed-tables
- Table Calculations
- Table Combine
- Table Slice
- Table Sort
- Table Examples