Select menu: Graphics | Stem and Leaf
Draws a stem and leaf plot from a variate of data. The plot comprises stems indicating leading digits, and leaves indicating subsequent digits. The plots are formed from ordinary printing characters and appear in the Output window.
- After you have imported your data, from the menu select
Graphics | Steam and Leaf. - Fill in the fields as required then click Run.
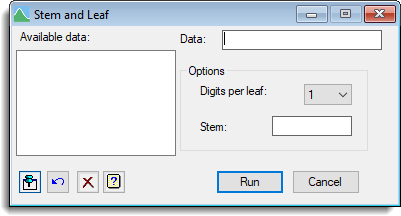
Available data
This lists data structures appropriate to the current input field. It lists variates for specifying the data values. Double-click a name to copy it to the current input field or type the name.
Data
Specifies a variate containing the data to be plotted.
Options
Lets you specify the number of Digits per leaf and the Stem units. For example, with 2 digits per leaf and stem units of 100, the value 251.4 will appear as the value 51 in a row labelled 2. If you do not specify stem units an appropriate default value will be calculated from the data.