These examples use the Genstat spreadsheet file ‘New Zealand Income Survey.gsh‘ in the Data folder in the Genstat directory.
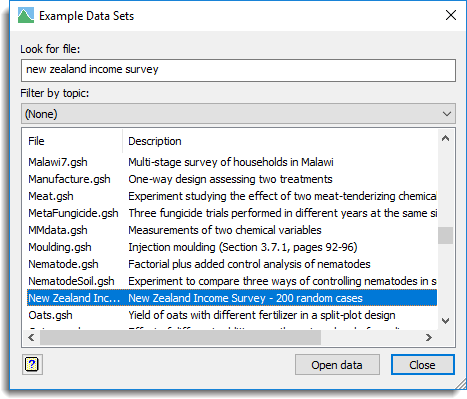
- To open this select File | Open Example Data Sets then click the Filter by topic dropdown list.
- Select Introduction to the Genstat Spreadsheet from the list then select the file New Zealand Income Survey.gsh.
The spreadsheet for this is shown below.
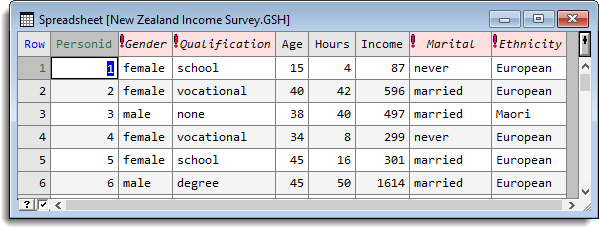
This spreadsheet contains the income information of 200 randomly selected workers in New Zealand. One of the things you would want to do for this data is to create summary tables of the means and counts across various of the classifications in this data (Gender, Qualification, Marital, and Ethnicity) of the measurements of hours and Income.
- From the menu select Stats | Summary Statistics | Summary Tables.
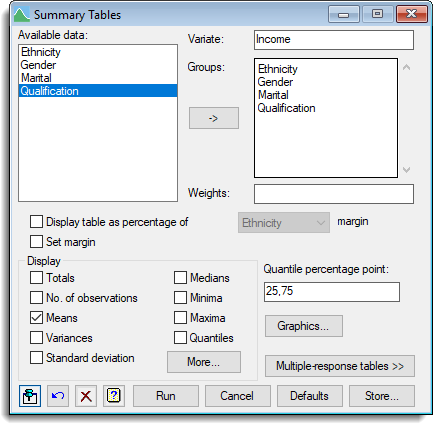
This opens the following dialog:
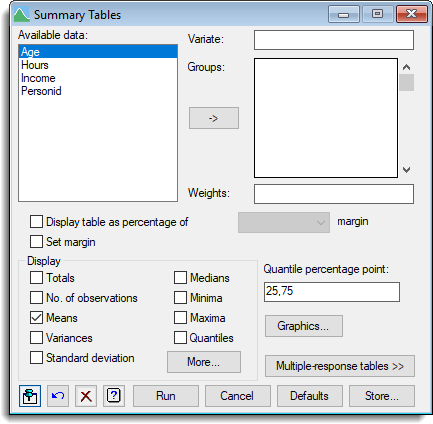
- Double-click the variate Income to move it into the Variate field.
- Multi-select the groups Ethnicity, Gender, Marital and Qualification by holding down the keyboard Shift key then click
 to move them all into the Groups field in one action.
Setting up the dialog as shown below enables us to form cross tabulated means over all of these combinations.
Creating a Summary table
The results can be displayed in a spreadsheet as follows.
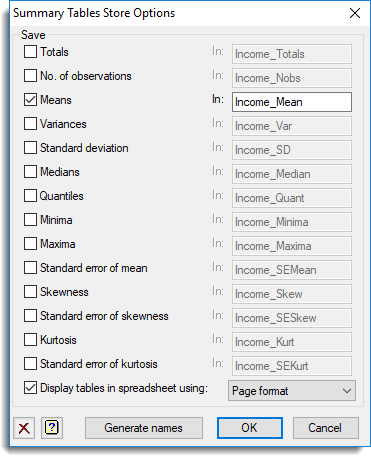
- Click Store to open the Store Options dialog.
- Click Generate names to create names for the tables.
- Select the Means check box, and the Display tables in spreadsheet using check box.
- Select Page Format in the dropdown list.
The dialog will look as below when filled in.
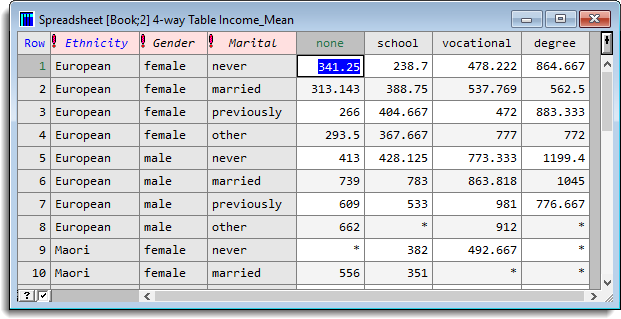
- Click OK to close the dialog then click Run to create the spreadsheet shown below.
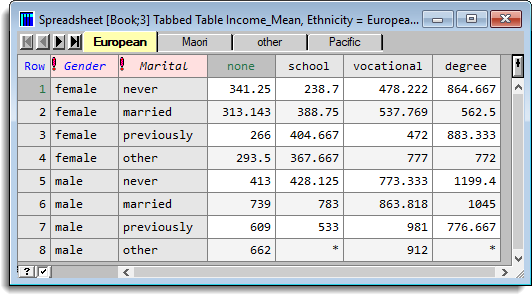
If you had selected the Tabbed format item in the dropdown list in Store Options this would produce the multi-paged spreadsheet with the Ethnicity displayed across the tabs as below.
Now that you have created a table you can manipulated it in a number of ways, including taking subsets of the tables (slicing), and combining levels together in factors
Slicing a table
The table of mean incomes by the four factors can be sliced to look at Pacific males. We can select two slices, one with just males selected for Gender and the other with Maori and Pacific selected for Ethnicity.
- To do this, from the menu select Data | Table Slice and select the table Income_Mean.
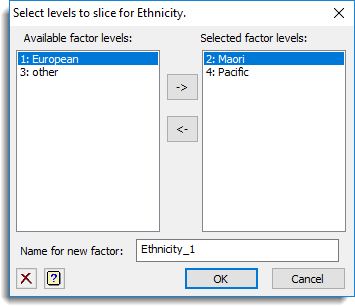
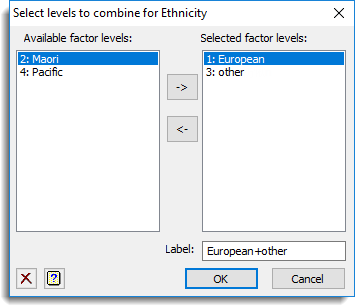
The following images show the selection of levels for the two classifying factors.
- Fill out the dialog as shown below using the instructions that follow.
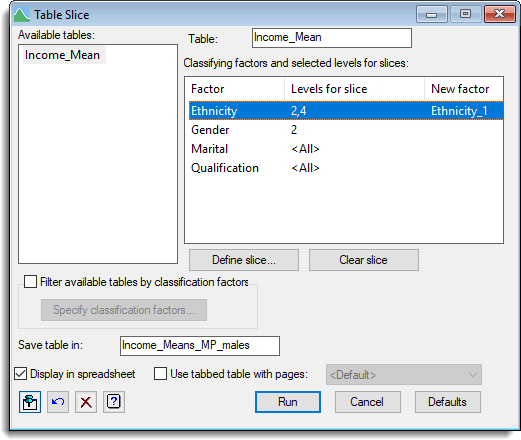
- Double-click Income_Mean to move this into the Table field.
- Select Ethnicity then click Define slice.
- Highlight the Maori and Pacific levels then move them across to Selected factor levels by clicking
- Click OK.
- Now select Gender and click Define slice.
- Highlight male then move this across to Selected factor levels and click OK.
- In the Save table in field type Income_Means_MP_males.
- Now click Run.
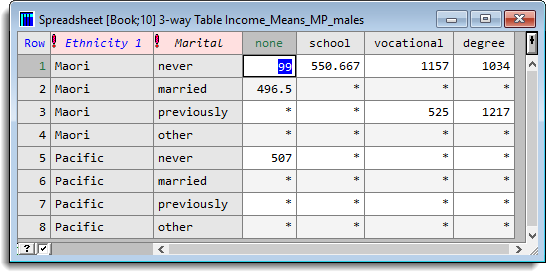
This is the resulting table:
Sorting a table
- From the menu select Stats | Summary Statistics | Summary Tables
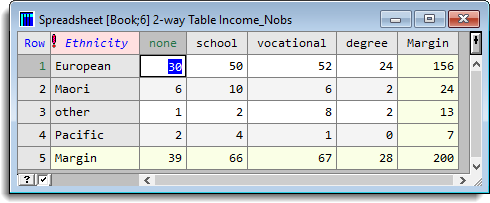
To create a table of counts for Ethnicity and Qualification, fill out the dialog as shown below using the instructions that follow.
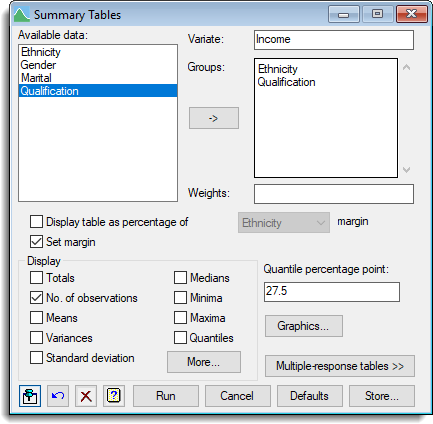
- Click Store, select No. of observations and deselect Means.
- Click OK to return to the previous dialog.
- In the Groups field, select Gender and Marital then press your keyboard Delete key to remove these.
- Select Set Margin then click Run.
This produces the table below.
To sort the factor levels of this table:
- From the menu, select Data | Table Sort.
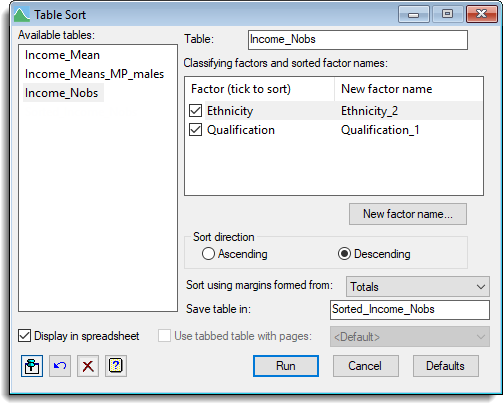
- Select Income_Nobs to move this into the Table field.
- Select Descending as the Sort direction.
- In the Save table in field type Sorted_Income_Nobs.
- Now click Run.
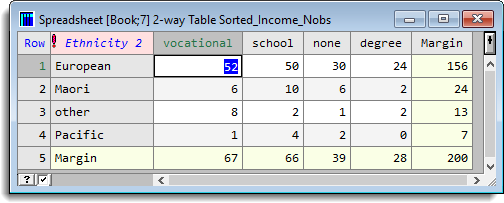
This is the resulting table:
Combining groups in a table
Using the Ethnicity x Qualification table above (Income_Nobs) we may want to produce a summary combining certain of the factor levels. We can create a table as follows:
– For Ethnicity we combine Maori and Pacific into one group and we combine European and other onto another.
– For Qualification we combine the two lowest qualifications none and school into one group and the two highest levels (vocational and degree) into another.
- To do this, from the menu select Data | Table Combine Levels.
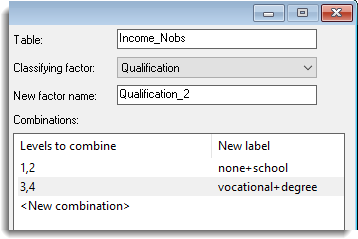
- Fill out the dialog as shown below using the instructions that follow.
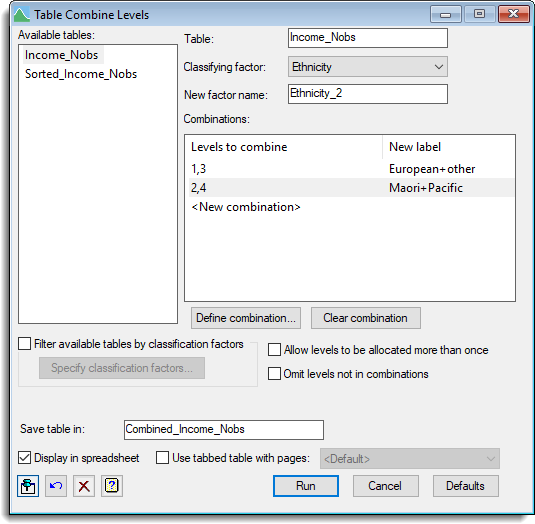
- Double click Income_Nobs to move this into the Table field.
- To set the groups for the Qualification factor, select Qualification in the Classifying factor dropdown list.
- Click Define combination then combine the none and school levels and click OK.
- Repeat the above step to combine the vocational and degree levels.
Your dialog should look like the one below.
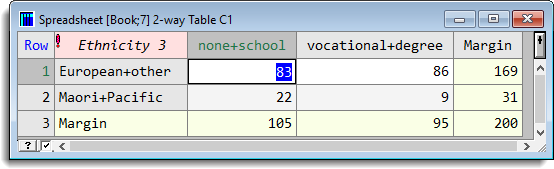
- In the Save table in field type Combined_Income_Nobs.
- Click Run to produce the following table.
Calculating tables from existing tables
The Data | Table Calculations menulets you calculate new tables from existing tables. The classifying factors do not need to match, so that if an A x B table (say AB_Table) is multiplied by an A table (say A_Table), each level of A in AB_Table is multiplied by the matching value from A_Table across all levels of B. For example if we form the two tables below from the Summary tables dialog.
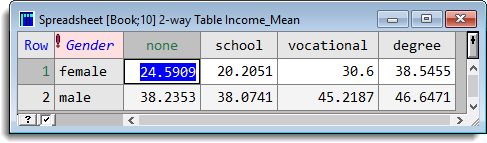
Table 1. Created as the means of the variate Income grouped by Gender and Qualification.
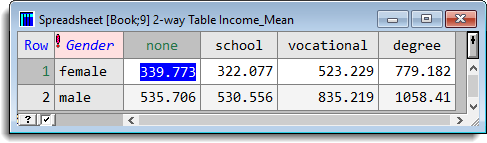
Table 2. Created as the means of the variate Hours grouped by Gender and Qualification.
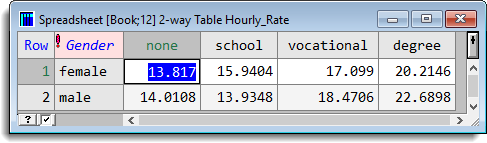
Then we can calculate the average income per hour for the groups by entering the calculation as shown in the Table Calculations dialog shown below (select Data | Calculations). Here we’ve filled it in to calculate the average pay rate of individuals in the survey by Gender and Qualification and to display this in a spreadsheet as in Table 3 below.
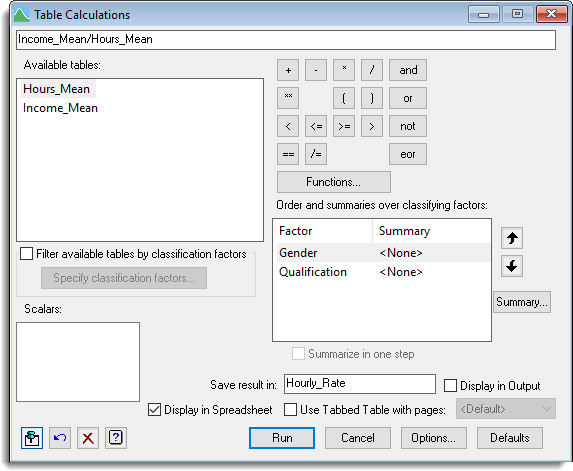
Table 3. Giving average income per hour calculated as Table 1 (average income) / Table 2 (average hours) by Gender and Qualification.