Select menu: Data | Table Calculations
Use this to calculate new tables from existing tables. You can add, subtract, multiply and divide tables, along with a wide range of other arithmetic and Boolean operations. The tables with matching classifying factors have corresponding cell values operated on by the expression.
For example, if there are two A x B tables called S and T, where i indexes A and j indexes B, then U = S + T, has cells Uij = Sij + Tij. Where tables have different classifying factors, the resulting table will have the union of the classifying factors, and the values in the cells will be used from the matching levels of the classifying factors from each tables used in the expression. For example, if V is a 1-way table classified by A and W is a 1-way table classified by B, Y = S + V + W will have cells Yij = Sij + Vi + Wj.
When creating a table you can summarize over some of the classifying factors to remove them and replace the results in each of the cells of the other classifying factors by a summary statistic over the removed factors. For example, if we use a total summary for factor B in the calculation Z = S + T, then Z has cells Zi = ∑j(Sij + Tij).
The calculation expression is displayed at the top of the menu and can be constructed step by step by combining data structures and operators. You can use brackets to control the order of evaluation when required. You can also type directly into the expression box, or click buttons, or double click data structure names in the table or scalar available data lists to build the expression.
When forming a calculation, all the tables in the calculation must be consistent with respect to having margins, i.e. either they all must have margins or none must have margins. If a mixture of presence/absence of margins occurs, a warning in red will be displayed below the syntax field.
- After you have imported your data and created a table, from the menu select Data | Table Calculations.
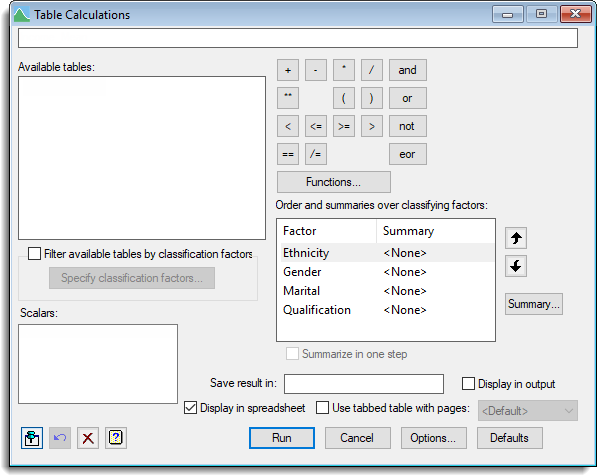
Available tables
Lists the available table data structures. Double-click a name to copy it into the expression being formed or the Save result in field. Move the cursor over a name in the list to display a tooltip showing the classifying factors. This list can be reduced to only display those tables with specific classifying factors by selecting the Filter available tables by classification factors checkbox and choosing the factors.
Filter available tables by classification factors
Select this to use the factors listed in the Select classifying factors for table list menu to filter the tables shown in the Available tables list.
Specify classification factors
This opens a menu that lets you select classifying factors for the table list. Only tables with classifying factors matching the selected list will then be displayed in the Available tables list.
Scalars
Lists scalar structures which can be used in the expression. Double-click a name to copy it into the expression being formed.
Functions
Enables you to insert a function into the expression. Only functions appropriate for table calculations are displayed.
Keypad
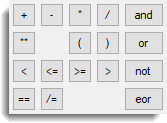
Use the keypad to enter operators into the expression being formed. You can also type the corresponding text directly into the expression, but note that the logical operators (and, eqs, or, nes, not, is, in, ni, eor, isnt) must be delimited by dots (for example .and.).
Order and summaries over classifying factors
This lists the classifying factors in the resulting table from the calculation expression. You can change the order of the classifying factors in the resulting table by selecting a factor and using the up  and down
  arrows. You can remove a factor from the resulting table by summarizing over its levels. Double-clicking the factors name, or clicking the Summary button will open a menu where you can select the summary type to use.
Summary
Lets you select the summary statistic for the classifying factor in the list. Selecting a summary statistic will collapse the table across that classifying factor and will remove the factor from the table.
Summarize in one step
When you are summarizing more than one factor using the same summary statistic for each factor being removed, this option becomes available. When selected, a summary is formed across all factors being removed. This can make a difference if there are missing cells in the table. For example, if summarizing over A & B, each with two levels, and cell A2B2 is missing then the summary using means will be MEAN(A1B1,A2B1,A1B2) using this option, and otherwise if we summarize over A and then B it would be MEAN(MEAN(A1B1,A2B1),A1B2).
Save result in
Specifies a table structure to contain the result of the expression.
Display in output
Lets you display the results in the Output window.
Display in spreadsheet
Lets you display the results in a new spreadsheet.
Use tabbed table with pages
Select this to create a spreadsheet using a tabbed-table. The factor across the pages/tabs will be the classifying factors selected from the dropdown list of classifying factors in the table. The default page factor is the first classifying factor in the table. A table must have at least 3 classifying factors to be displayed in a tabbed-table.
Action Icons
| Pin | Controls whether to keep the dialog open when you click Run. When the pin is down |
|
| Restore | Restore names into edit fields and default settings. | |
| Clear | Clear all fields and list boxes. | |
| Help | Open the Help topic for this dialog. |
Example
Examples of creating and manipulating tables can be found in Table examples.
See also
- Table calculation options
- Calculate functions
- Table combine menu
- Table slice menu
- Table sort menu
- Tabbed-tables
- CALCULATE directive
- Summary tables menu
- Frequency tables menu
- Calculations menu
- Data Menu