Use this to save summary information for grouped data. These results are saved when you click Run in the main Summary Tables dialog.
- After selecting the appropriate boxes, type names for the data structures into the corresponding In: fields.
Alternatively, click Generate names to auto-fill the fields with names.
The table below indicates the type of structures formed for each item.
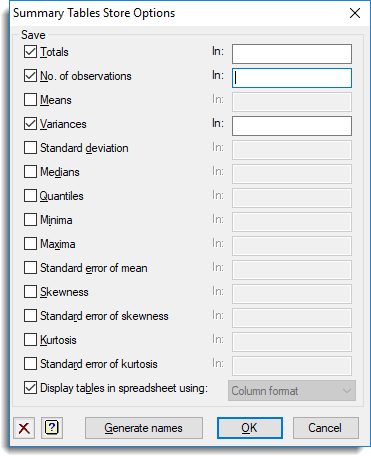
Save
| Totals | Table | The totals for each group. |
| No. of observations | Table | The number of observations in each group. |
| Means | Table | The arithmetic mean for each group. |
| Variances | Table | The variance of the values for each group. |
| Standard deviation | Table | The standard deviation of the values for each group. |
| Medians | Table | The median value in each group. |
| Quantiles | Table or Pointer | The quantiles for each group. If a list of two or more quantiles is specified, the results will be stored in a pointer which points to individual tables for each quantile. |
| Minima | Table | The minimum value in each group. |
| Maxima | Table | The maximum value in each group. |
| Standard error of mean | Table | The standard error of mean of the values for each group. |
| Skewness | Table | The skewness of the values for each group. |
| Standard error of skewness | Table | The standard error of skewness of the values for each group. |
| Kurtosis | Table | The kurtosis of the values for each group. |
| Standard error of kurtosis | Table | The standard error of kurtosis of the values for each group. |
Display tables in spreadsheet using
Select this to display the results in a new spreadsheet window. The format of the spreadsheet can be controlled by the choices in the dropdown list.
| Page format | Each table is displayed on a single page in a separate spreadsheet. The last specified classifying factor indexes the columns in the spreadsheet. |
| Column format | The tables occupy a single column but multiple tables can be put in a single spreadsheet. This is the default for a table with a single classifying factor. |
| Tabbed format | Each table is displayed on a single page in a tabbed-table spreadsheet. The separate tables appear as tabs in the spreadsheet and manipulations on one table are propagated to all other tables in the book. If there is only a single table with three or more classifying factors being saved, then the table will be displayed as a tabbed-table with the first classifying factor’s groups indexing the tabs in the book. |