Select menu: Stats | Statistical Tests | Goodness of Fit
A Goodness of Fit test compares data values with a set of expected values.
- After you have imported your data, from the menu select
Select menu: Stats | Statistical Tests | Goodness of Fit. - Fill in the fields as required then click Run.
You can set additional Options then after running, you can save the results by clicking Save.
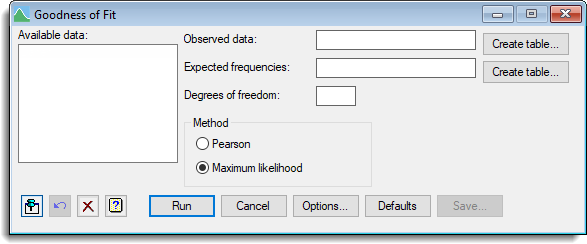
Available data
Lists the data structures appropriate to the current input field. The contents will change as you move from one field to the next. Double-click a name to copy it into the input field, or type the name in directly.
Observed data
Table containing the observed data values.
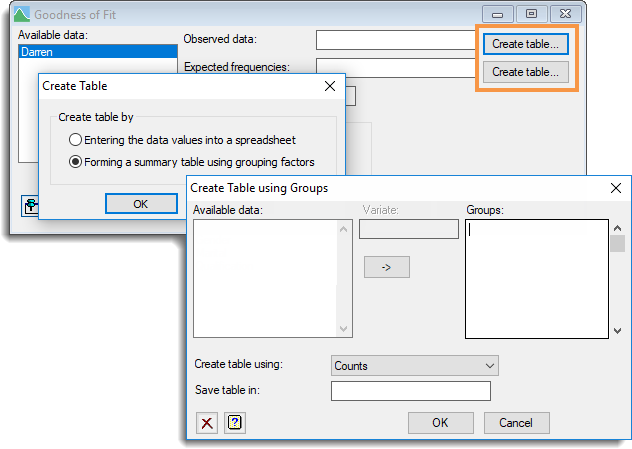
To create a table click Create table then select a method for populating the table with data: either as a spreadsheet or using grouping factors.
Expected frequencies
Table containing the expected frequencies.
To create a table click Create table then select a method for populating the table with data: either as a spreadsheet or using grouping factors.
Degrees of freedom
Specify the degrees of freedom. If you enter a value here Genstat can calculate the probability value for the test.
Method
You can choose between two ways of calculating the test: Pearson uses the familiar method; the alternative, which may be more accurate, is to use Maximum likelihood.
Create table
Lets you create a new table either from existing data or by typing the values into a blank spreadsheet.
See also
- CHISQUARE procedure in command mode
- Chi-square Tests of association for contingency tables
- Contingency Table Options
- Contingency Table Save Options
- Summary Tables to create tables from existing data