Select menu: Stats | Statistical Tests | Contingency Tables (Chi-square)
This performs statistical tests on contingency tables.
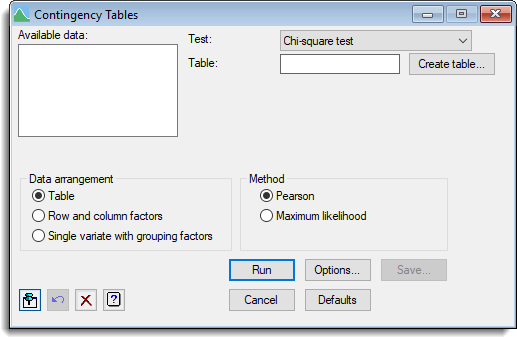
- After you have imported your data, from the menu select
Stats | Statistical Tests | Contingency Tables (Chi-square). - Fill in the fields as required then click Run.
You can set additional Options then after running, you can save the results by clicking Save.
Available data
This lists data structures appropriate to the current input field. The contents will change as you move from one field to the next. Double-click on a name to copy it into the input field, or type the name in directly.
Chi-square test
You can calculate the chi-square test of association between the factors classifying the rows and the columns of a two-way tables of counts.
Method
You can choose between two ways of calculating the test: Pearson uses the familiar method; the alternative, which may be more accurate, is to use Maximum likelihood.
Data arrangement
For a chi-square test you can enter the data in one of three ways.
| Table | Create a two-way table containing the counts. Click Create table then create a table from existing data, or type the values into a new spreadsheet. |
| Row and column factors | You can supply 2 factors; one containing rows and one containing columns. Genstat will automatically create a two-way table of frequency counts and this will be used in the test. |
| Single variate with grouping factors | Enter the counts in a variate along with classifying factors for the rows and columns. This is the same layout as you would use in a log-linear analysis. Genstat automatically forms a two-way table from these data structures and performs a chi-square test on the table. |
Fisher’s exact test
This menu performs Fisher’s exact test of association between the factors classifying a 2×2 table of counts. It provides the one-tailed significance level from the exact test, together with the mid-p value, which includes only half the probability of the observed data table.
Two methods are used to calculate a two-tailed significance level. The first simply doubles the one-tailed significance level: the second method calculates the cumulative probability of all outcomes that are no more probable than the observed table. Mid-p values are produced for each of these methods.
Table (for Fisher’s exact test)
Specifies the two-way, 2×2 table containing the counts. Create a two-way table containing the counts. Click Create table then create a table from existing data, or type the values into a new spreadsheet.
An alternative method to enter data for a Fisher’s exact test is to type the four values from the 2×2 table into the Table field on the previous dialog, separating them by commas. For example: 4,6,7,6

See also
- Chi-square goodness-of-fit menu
- Summary tables menu to create tables from existing data
- Frequency tables menu
- Contingency table (chi-square) options dialog
- Contingency table (chi-square) save options dialog
- Create a table using groups
- Create a table using the spreadsheet
- CHISQUARE procedure for calculating chi-square statistics in command mode.
- CHIPERMTEST procedure for calculating chi-square permutation test.
- Procedure FEXACT2X2 is used to perform the calculations for Fisher’s exact test. If you use this in command mode, you can also set its PRINT option to ‘tables’ to display all 2×2 tables with margins that are the same as the observed table, together with their probabilities of occurrence under the null hypothesis of no association and the cumulative probabilities calculated from both tails.