Select menu: Stats | QTLs (linkage/Association) | Data Exploration | Phenotypic Data | Summary Statistic Single Environment
Use this to produce summary statistics for data contained within variates.
- After you have imported your data, from the menu select
Stats | Summary Statistics | Summary Statistics.
OR
After you have imported your QTL data select Stats | QTLs (linkage/Association) | Data Exploration | Phenotypic Data | Summary Statistics Single Environment.
- Fill in the fields as required then click Run.
After running, you can save the results by clicking Save.
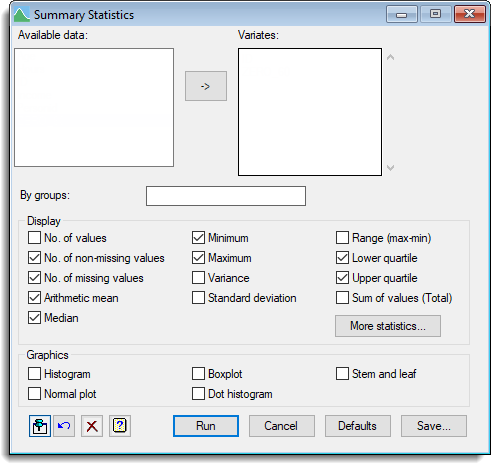
Available data
This lists variates that are available for analysis. Double-click a name to copy it to the current input field or type the name.
Variates
Specifies the variates containing the data to be analysed. You can transfer multiple selections from Available data by holding the Ctrl key on your keyboard while selecting items, then click ![]() to move them all across in one action.
to move them all across in one action.
By groups
Lets you specify a factor of groupings, so that summaries can be produced for each group in turn.
Display
Provides a range of statistics that can be used to describe the data. Select the check boxes for the statistics that you wish to use to calculate for the data. You can choose one or more of the following:
| No. of values | Number of values including missing values |
| No. of non-missing values | Number of values excluding missing values |
| No. of missing values | Number of missing values |
| Arithmetic mean | Mean of the sample – ∑x/n |
| Median | Median value that divides a sample into two equally sized groups |
| Minimum | Minimum value in sample |
| Maximum | Maximum value in sample |
| Variance | Variance of sample – ∑(xi-mean(x))2/(n-1) |
| Standard deviation | Standard deviation of sample – √ (Variance) |
| Range (max-min) | Range of the values in the sample, i.e. maximum – minimum |
| Lower quartile | The lower quartile is the value l such that 25% of a sample are less than l |
| Upper quartile | The upper quartile is the value u such that 25% of a sample are greater than u |
| Sum of values | Sum of the values in the sample |
More summary statistics such as standard error of the mean, skewness, and kurtosis can be selected by clicking the More statistics button.
Graphics
Provides various graphical summaries of the data that can be used to explore the distribution of the data. You can select one or more from Histogram, Boxplot, Stem and leaf, Normal plot, and Dot histogram.
Action buttons
| Run | Run summary statistics. |
| Cancel | Close the dialog without further changes. |
| Defaults | Reset options to the default settings. Clicking the right mouse on this button produces a shortcut menu where you can choose to set the options using the currently stored defaults or the Genstat default settings. |
| Save | Opens a dialog to specify names of structures to save the results from the summary statistics. |
Action Icons
| Pin | Controls whether to keep the dialog open when you click Run. When the pin is down |
|
| Restore | Restore names into edit fields and default settings. | |
| Clear | Clear all fields and list boxes. | |
| Help | Open the Help topic for this dialog. |
See also
- Save Options for details of how to save computed quantities.
- Summary tables menu
- Multiple Summary Tables menu
- DESCRIBE procedure
- The Graphics section of the menu bar for histograms, boxplots, dotplot, rugplots, and stem and leaf plots for graphical summaries of data.
- The QUANTILE procedure, in command mode, provides general calculation and printing of quantiles.