Select menu: Graphics | Histogram
Use this to specify data for a histogram.
- After you have imported your data, from the menu select
Graphics | Histogram. - Fill in the fields as required then click Run.
You can set additional options and axis settings by clicking the Options, Axis and Frame tabs.
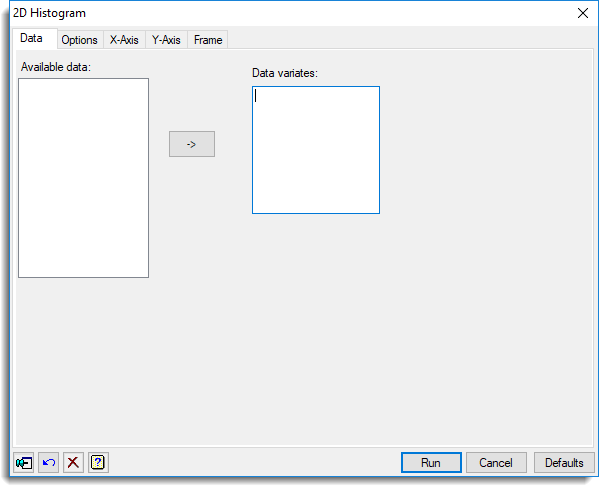
Available data
This lists the variates for specifying the data. Double-click a name to copy it to the current input field or type the name.
Data variates
Specifies the data to be displayed in a histogram. Double-click a name in the Available data field to copy it across or type the name. You can transfer multiple selections from Available data by holding the Ctrl key on your keyboard while selecting items, then click ![]() to move them all across in one action.
to move them all across in one action.
Action buttons
| Run | Produce the graph. |
| Cancel | Close the dialog without further changes. |
| Defaults | Reset options to their default settings. |
Action Icons
| Pin | Controls whether to keep the dialog open when you click Run. When the pin is down |
|
| Restore | Restore names into edit fields and default settings. | |
| Clear | Clear all fields and list boxes. | |
| Help | Open the Help topic for this dialog. |
See also
- Histogram options tab menu
- Boxplot and Rugplot menus for an alternative way to display the distribution of a data set
- Axis and Frame options.
- Bar Chart menu
- Plot Table menu
- Boxplot menu
- Mosaic Plot menu
- Dot Histogram menu
- Density Plot menu
- DHISTOGRAM directive