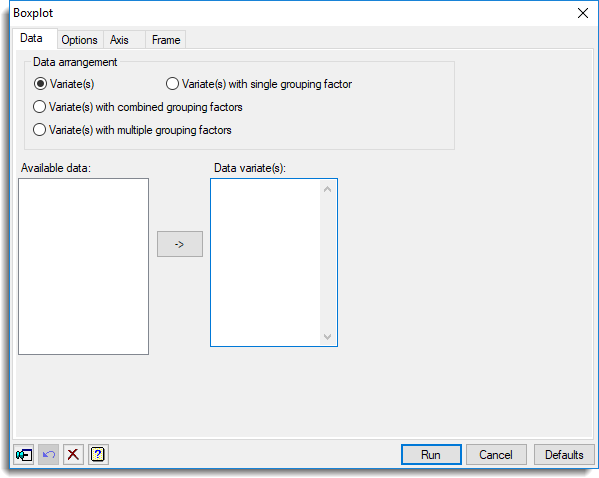
Select menu: Graphics | Boxplot
Use this to produce boxplots to display the distribution of one or more sets of data. In a boxplot the box spans the interquartile range of the values so that the middle 50% of the data lie within the box, with a line indicating the median.
- After you have imported your data, from the menu select
Graphics | Boxplot. - Fill in the fields as required then click Run.
You can set additional options and axis settings by clicking the Options tab, Axis tab and Frame tab.
The whiskers extend beyond the ends of the box to represent the range of the data. The whiskers can be drawn using the box-and-whisker method where a line is drawn as far as the minimum and maximum values. Alternatively, they can be drawn using a schematic method which displays individual outlying points as well as the box.
In a schematic plot the whiskers extend only to the most extreme data values within the inner “fences”, which are at a distance of 1.5 times the interquartile range beyond the quartiles, or the maximum value if that is smaller. Individual outliers are then displayed as points. “Far” outliers, beyond the outer “fences” which are at a distance of three times the interquartile range beyond the quartiles, are plotted with a different colour. The method used to draw the boxplots is controlled on the Options tab.
Available data
This lists data structures appropriate to the current input field. It lists either factors for specifying the groups, or variates for specifying the data. The contents will change as you move from one field to the next.
Data variate(s)
Specifies the data to be plotted. Double-click a name in the Available data field to copy it across or type the name. You can transfer multiple selections from Available data by holding the Ctrl key on your keyboard while selecting items, then click ![]() to move them all across in one action.
to move them all across in one action.
Grouping factor(s)
Specifies a grouping factor for each variate to indicate that the data are to be partitioned into different groups within the plot.
Action buttons
| Run | Produce the graph. |
| Cancel | Close the dialog without further changes. |
| Defaults | Reset options to their default settings. |
Action Icons
| Pin | Controls whether to keep the dialog open when you click Run. When the pin is down |
|
| Restore | Restore names into edit fields and default settings. | |
| Clear | Clear all fields and list boxes. | |
| Help | Open the Help topic for this dialog. |
See also
- Boxplot options tab menu
- Axis and Frame options
- Histogram, Rug plot, Dot Histogram and Density plot menus for an alternative way to display the distribution of a data set.
- BOXPLOT procedure in command mode