Use this to set attributes to control the appearance of the boxplot.
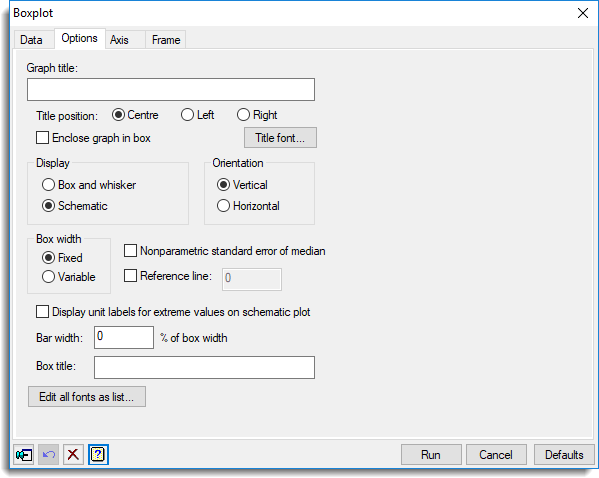
Graph title
Lets you enter a title for the graph. The title appears centred at the top of the graph.
Title position
You can position the title by selecting the Centre, Left or Right option.
Enclose graph in box
Select this to draw an enclosing box around the graph.
Title font
This opens the Edit Font dialog that lets you control the font for the title.
Display
This lets you choose between two types of plot. In a Box-and-whisker diagram, there is a box that spans the interquartile range of the values in the variate, with a line indicating the median. Whiskers are drawn extending beyond the ends of the box as far as the minimum and maximum values. Schematic plots are modifications of box-and-whisker diagrams which display individual outlying points as well as the box. The whiskers are dashed, and extend only to the inner “fences” which are shown as dashed lines. The upper inner fence is defined as the upper quartile plus 1.5 times the interquartile range, or the maximum value if that is smaller. The lower fence is defined similarly.
Orientation
Lets you specify the orientation of the plot. You can select either Horizontal or Vertical.
Box width
This lets you specify how the box widths are to be drawn. Select Fixed if the boxes are to be plotted with equal widths or Variable to scale them by the square root of the number of values represented.
Nonparametric standard error of median
Select this to add a central bar to each boxplot, giving a non-parametric estimate of the standard error of the median. This is calculated as the distance between the quartiles, multiplied by 1.5, and divided by the square root of the number of values in the data.
Reference line
Select this to specify the position of a reference line to be drawn parallel to the box axis.
Display unit labels for extreme values in schematic plot
Select this to display unit labels for extreme values next to the points in a schematic plot. Alternatively unit labels for extreme points can be viewed using the data information tool in the Graphics Viewer.
Bar width
Lets you set the size of the bar which appears at the end of the whiskers. Enter the value as a percentage of the box-width, such that 0 produces no bar and 100 draws a bar of full width.
Box title
For the axis representing different variates or groups.
Colour boxes
This lets you fill the boxes in the plot with colour, If Use a common colour is selected, just one common colour will be applied to all boxes. This is disabled if there is only a single box. To change the colour, click the Colour box, and choose a new colour from the pop-up colour selector. If there are multiple boxes in the plot, a Graph drop-down list is displayed, and unselecting the Use a common colour check box will enable this. Then separate colours can be applied to each box. To change the colour of a specific box, select the box number from the Graph list, and then select the colour for this item with using the Colour box. The data to plot must be specified first to ensure the number of boxes are correct. If this is changed, the colour list for boxes will be maintained where possible, but extended with the common colour if the number of boxes has increased.
Edit all fonts as a list
Clicking this opens the Edit All Fonts as a List dialog which allows all the fonts in the graph to be set in one place.
Action buttons
| Run | Produce the graph. |
| Cancel | Close the dialog without further changes. |
| Defaults | Reset options to their default settings. |
See also
- Boxplot data tab menu
- 2D Scatter Plot data tab menu
- Axis and Frame options.
- Text Sizes and Fonts options
- Edit font dialog
- Edit All Fonts as a List
- Graphics menus
- BOXPLOT procedure