Graphics Menu Commands

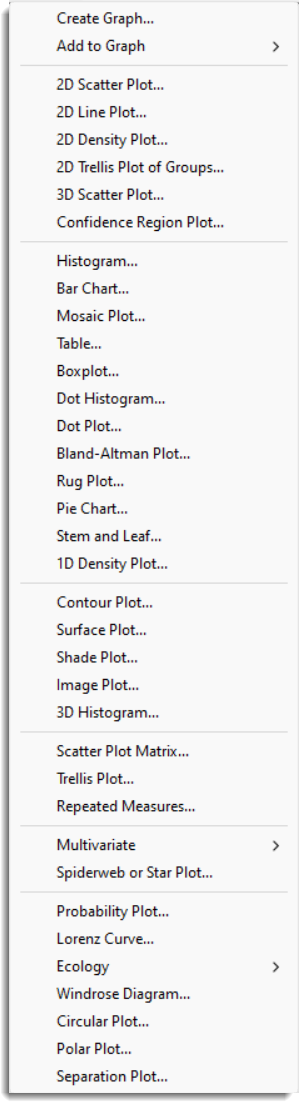
This section describes the plots that can be created using the Graphics menu. Genstat graphics are generated by the Genstat Server and drawn in a separate Graphics Viewer where you can edit their display properties before they are printed or saved to file. 

See also Graphs Overview and watch our videos on Creating and Customizing Graphs.

Create Graph 
Add to Graph
      – Text 
      – Reference Line 
      – Arrow
      – Error bar
2D Scatter Plot
2D Line Plot
2D Density Plot
2D Trellis Plot of Groups
3D Scatter Plot
Confidence Region Plot
Histogram
Bar Chart
Mosaic Plot
Table
Boxplot
Dot Histogram
Dot-Plot
Band-Altman Plot
Rug Plot
Pie Chart
Stem and Leaf
1D Density Plot
Contour Plot
Surface Plot
Shade Plot
Image Plot
3D Histogram
Scatter Plot Matrix
Trellis Plot
Repeated Measures
Multivariate
      – Biplot
      – Minimum Spanning Tree
Spiderweb or Star plot
Probability Plot
Lorenz Curve
Ecology
      – Species Abundance Plot
      – Species Accumulation Curves
Windrose Diagram
Circular Plot
Polar Plot
Separation Plot

Updated on February 16, 2023

Was this article helpful?