Select menu: Graphics | Circular Plot
Use this to plot data values that consist of directional observations recorded as angles between 0 and 360 degrees.
- After you have imported your data, from the menu select
Graphics | Circular Plot. - Fill in the fields as required then click Run.
You can set additional options and axis settings by clicking the Options and Frame tabs.
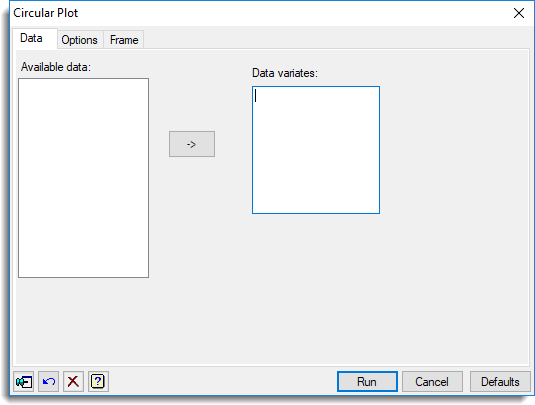
Data variates
Specifies a factor or variate containing the direction observations. If a variate is supplied, the observations are grouped for plotting into sectors based on the width (in degrees) and centres specified in the additional options. If a factor is supplied, its levels define the midpoints of the sector.
See also
- Circular Plot – options menu
- Polar Plot menu
- The DCIRCULAR procedure