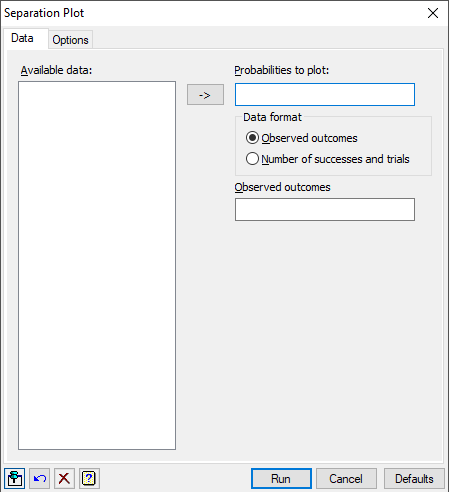
Use this to display a separation plot using the DSEPARATIONPLOT procedure. A separation plot is used to display the fit of a model with a dichotomous (i.e. binary) or polytomous (i.e. multi-categorical) outcome. It provides a visualisation of a model’s ability to predict occurrences of the event of interest (i.e. successes) with high probability, and non-occurrences (i.e. failures) with low probability.
- After you have imported your data, from the menu select
Graphics | Separation Plot. - Fill in the fields as required then click Run.
You can set additional options by clicking the Options tab.

Available data
This lists data structures appropriate to the current input field. It lists either variates or matrices for the probabilities, factors or variates for specifying the outcomes, and variates for the number of successes and trials. The contents will change as you move from one field to the next. Double-click a name to copy it to the current input field, or click the transfer arrow to transfer the selected item in the list.
Data format
Specifies the form of the data to be used in the plot. The data can be supplied as a factor or variate giving the Observed outcomes or two variates giving the Number of successes and trials.
Probabilities
Specifies a variate containing probabilities of success for a binary outcome (i.e. for binary or binomial data), or matrix containing probabilities of membership in each group for a polytomous outcome. In the matrix, the columns give the probability of membership for the corresponding group in the Observed outcomes factor. Double-click a name in the Available data field to copy it across, or click the transfer arrow, or type the name directly into the field.
Data supplied as observed outcomes
Observed outcomes
Specifies the observed outcomes to be plotted against the probabilities. If probabilities is a variate, this should be a 2-level factor or a variate with zeros and ones. If the probabilities are in a matrix, the factor should have same the number of levels as columns in the matrix, and the same number of rows as the matrix. Double-click a name in the Available data field to copy it across, or click the transfer arrow, or type the name in directly into the field.
Data supplied as number of successes and trials
Number of successes
Specifies a variate containing the number of successes. Double-click a name in the Available data field to copy it across, or click the transfer arrow, or type the name directly into the field.
Number of trials
Specifies a variate containing the number of trials. The number of trials must not be less than the number of successes for all units in the variates. Double-click a name in the Available data field to copy it across, or click the transfer arrow, or type the name in directly into the field.
Action buttons
| Run | Produce the graph. |
| Cancel | Close the menu without further changes. |
| Defaults | Change the menu settings back to their default settings. |
Action Icons
| Pin | Controls whether to keep the dialog open when you click Run. When the pin is down |
|
| Restore | Restore names into edit fields and default settings. | |
| Clear | Clear all fields and list boxes. | |
| Help | Open the Help topic for this dialog. |
See also
- Separation Plot – Options tab
- DSEPARATIONPLOT procedure
- Generalized Linear Model Further Output dialog