Generates further output after fitting a generalized linear model.
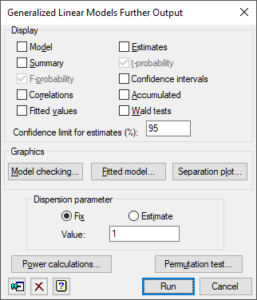
Display
| Model | Details of the model that is fitted |
| Summary | Summary analysis-of-deviance |
| F-probability | Approximate F probabilities for deviance ratios |
| Correlations | Correlations between the parameter estimates |
| Fitted values | Table containing the values of the response variate, the fitted values, standardized residuals and leverages |
| Estimates | Estimates of the parameters in the model |
| t-probability | Approximate t probabilities for the parameter estimates |
| Confidence intervals | Confidence intervals for the parameter estimates. The confidence limit can specified as a percentage using the Confidence limit for estimates (%) field. |
| Accumulated | Analysis of deviance table containing a line for each change in the fitted model |
| Wald tests | Wald and F tests for dropping terms from a regression (not available for multinomial or ordinal regression) |
Model checking
You can generate diagnostic plots for Graph of fitted model which shows the relationship of the response variate with one explanatory variate or one grouping factor or both. The fitted relationship is shown as one or more lines and the partial residuals are positioned with respect to the lines to represent the observed data.
Separation plot
The fitted probabilities will be saved and displayed in a Separation Plot.
Dispersion parameter
Controls whether the dispersion parameter for the variance of the response is estimated from the residual mean square of the fitted model, or fixed at a given value. The dispersion parameter (fixed or estimated) is used when calculating standard errors and standardized residuals. In models with the binomial, Poisson, negative binomial, geometric and exponential distributions, the dispersion should be fixed at 1 unless a heterogeneity parameter is to be estimated. Fixing the dispersion parameter on the GLM Further Output menu only affects output generated here. It does not alter the Dispersion setting on the GLM Options menu, or the status of the fitted model.
Power calculations
You can calculate the power for a regression model.
Permutation test
Lets you perform random permutation tests for a regression model. This can be used to generate probabilities for deviances or deviance ratios in generalized linear models, instead of using the customary chi-square or F distributions.
Action Icons
| Pin | Controls whether to keep the dialog open when you click Run. When the pin is up |
|
| Clear | Clear all fields and list boxes. | |
| Help | Open the Help topic for this dialog. |
See also
- Log-linear modelling
- Modelling binomial proportions
- Probit analysis
- General model
- Multinomial regression
- Predictions from Generalized Linear Model
- Plot table of predictions
- Separation Plot
- Further Output
- Change Regression Model
- Saving Results
- Save Individual Regression Terms dialog
- Multiple Comparisons for Predictions options
- Least Significant Intervals Plot Options dialog