Use this to control the appearance of the separation plot.
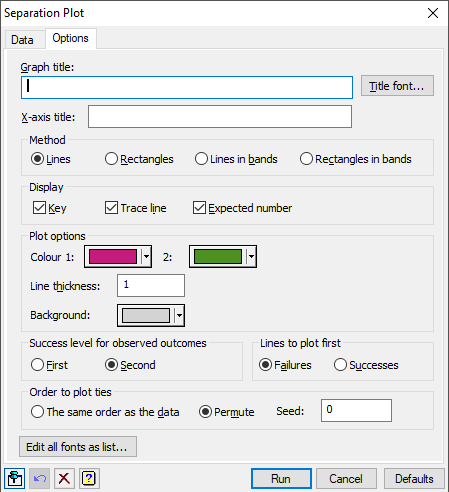
Graph title
Lets you enter a title for the graph. The title appears centred at the top of the graph. If you do not specify a title, the DSEPARATIONPLOT procedure will generate a default title. If you wish to suppress the default title, put a space in the graph title field.
Title font
This opens the Edit Font dialog that lets you control the font for the title.
X-axis title
Lets you enter an X-axis title for the graph. The title appears below the bands.
Method
This specifies the method used to display the data.
| Lines | The predicted probabilities, ordered from smallest to largest, are plotted as lines that are coloured according to whether or not the observation corresponds to a success (i.e. an actual occurrence of the event of interest). |
| Rectangles | The predicted probabilities, ordered from smallest to largest, are plotted as rectangles that are coloured according to whether or not the observation corresponds to a success (i.e. an actual occurrence of the event of interest). |
| Lines in bands | A separate graph is drawn for each actual outcome (i.e. success/failure for dichotomous data or each group for polytomous data) with the predicted probabilities of that outcome ordered from smallest to largest, and plotted as lines. The lines are coloured using a graduated band of colours formed by grouping the predicted probabilities into distinct bands. |
| Rectangles in bands | A separate graph is drawn for each actual outcome (i.e. success/failure for dichotomous data or each group for polytomous data) with the predicted probabilities of that outcome ordered from smallest to largest, and plotted as rectangles. The rectangles are coloured using a graduated band of colours formed by grouping the predicted probabilities into distinct bands. |
Display
| Key | Adds a key to the plot using the DKEY procedure |
| Trace line | Adds a line graph of the ordered predicted probabilities when method is Lines or Rectangles |
| Expected number | Adds a symbol (a star) denoting the expected number of successes when method is Lines or Rectangles. This is calculated as the sum of the predicted probabilities for the occurrence of the event of interest (i.e. the sum of the predicted probabilities of success). |
Plot options
Controls the colours and elements used in drawing the plot.
Colours 1 and 2
These options let you control which colours are used for drawing the lines, rectangles or bands. For the Lines or Rectangles methods, Colour 1 and 2 give the colours for the failures and successes respectively. For the Lines in bands and Rectangles in bands methods, these give the starting colour and ending colour used to shade the lines or rectangles, and an example of the resulting colour range is shown in the Sample field. Click the colour buttons to select a new colour.
Line thickness
For the Lines and Lines in bands methods, this gives the thickness of the lines plotted. This must be between 0.1 and 10.
Plot borders around rectangles
For the Rectangles and Rectangles in bands methods, if this is checked, a black border will be drawn around the rectangles.
Number of groups
For the Lines in bands and Rectangles in bands methods, this gives the number of colour groups used to shade the lines or rectangles. This must be between 2 and 250.
Background colour
For the Lines and Lines in rectangles methods, this gives the background colour of the bands that the lines are plotted on. Click the colour button to select a new colour for the background.
Success level for observed outcomes
When a two level factor is given as an observed outcome with a variate for the probabilities, this controls which level is associated with a success. The other level is then taken as a failure.
| First | The first level of the factor is a success |
| Second | The second level of the factor is a success |
Lines to plot first
For the Lines method, this controls which level of a binary outcome will be plotted first. The lines plotted first will be overwritten by the alternative outcome when they overlap.
| Failures | Failures are plotted first |
| Successes | Successes are plotted first |
Order to plot ties
For the Lines or Rectangles methods, this controls the order to plot tied probability values.
| The same order as the data | The lines or rectangles will be plotted in same order as they are in the data |
| Permute | The plot order will be randomly permuted using the Seed provided |
Seed
This gives a seed to initialize the random number generator used for permuting the order to plot the data. Using zero continues an existing sequence or initializes this from the computer’s clock. Specifying a non-zero value gives a repeatable plot.
Edit all fonts as a list
Clicking this opens the Edit All Fonts as a List menu which allows all the fonts in the graph to be set in one place.
Action buttons
| Run | Produce the graph. |
| Cancel | Close the window without further changes. |
| Defaults | Reset the options to their default settings. |
Action Icons
| Pin | Controls whether to keep the dialog open when you click Run. When the pin is down |
|
| Restore | Restore names into edit fields and default settings. | |
| Clear | Clear all fields and list boxes. | |
| Help | Open the Help topic for this dialog. |
See also
- Separation Plot – Data tab
- Edit Font dialog
- Edit All Fonts as a List
- DSEPARATIONPLOT procedure