Select menu: Graphics | Lorenz Curve
Use this to plot Lorenz curves and calculate the Gini coefficient of inequality.
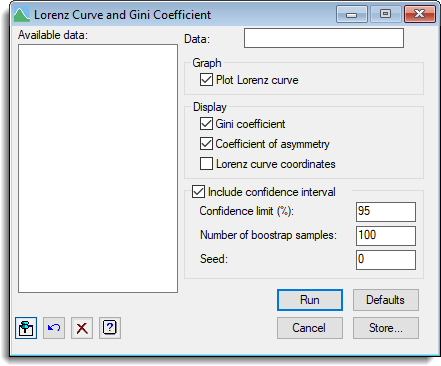
- From the menu select Graphics | Lorenz Curve.
Click Store to save the Gini coefficient or coefficient of asymmetry for a Lorenz curve.
The Lorenz curve provides a graphical representation of the inequality of a sample of numbers. In economics, the numbers could be the annual incomes of a group of people, or in ecology they could be population sizes of a set of species of animal or plant. The y-coefficients for the curve are formed by sorting the numbers, calculating their cumulative totals, and then dividing these by the grand total. The x-coefficients are simply the numbers 0, 1, … n, where n is the size of the sample. If the numbers are all equal the curve will form a straight line, known as the line of equality, running from the origin to the point (1, 1). Inequalities amongst the numbers cause the curve to lie below the line of equality.
The Gini coefficient is the area between the line of equality and the Lorenz curve area, divided by the area under the line of equality. So, a value close to zero indicates near equality, while a value near to one shows a high amount of inequality. The asymmetry coefficient assesses the amount of asymmetry of the Lorenz curve. The axis of symmetry for the curve is the line from (1, 0) to (0, 1). The coefficient is less than one if the point where the Lorenz curve is parallel to the line of equality lies below the axis of symmetry, and greater than one if it lies above the axis.
Available data
This lists data structures appropriate to the current input field. The contents will change as you move from one field to the next. You can double-click a name to copy it to the current input field or type the name.
Data
A variate containing the data whose equality is to be studied.
Graph
Specifies the plots to be displayed.
| Plot Lorenz curve | Plots the Lorenz curve. |
Display
Specifies the output to be displayed.
| Gini coefficient | Displays the Gini coefficient and confidence interval (if selected). |
| Coefficient of asymmetry | Displays the coefficient of asymmetry and confidence interval (if selected). |
| Lorenz curve coordinates | Displays coordinates of the Lorenz curve. |
Include confidence interval
| Confidence limit (%) | Specifies the confidence limit as a percentage. |
| Number of samples of bootstrap | Specifies the number of samples used in the bootstrap. |
| Seed | Specifies the seed to use in the random number generator used to construct the bootstrap samples. The default value of zero continues an existing sequence of random numbers or, if the generator has not yet been used in this run of Genstat, it initializes the generator automatically. |
Action Icons
| Pin | Controls whether to keep the dialog open when you click Run. When the pin is down |
|
| Restore | Restore names into edit fields and default settings. | |
| Clear | Clear all fields and list boxes. | |
| Help | Open the Help topic for this dialog. |
See also
- Lorenz curve save options menu
- LORENZ procedure