Select menu: Graphics | Multivariate | Minimum Spanning Tree
This plots an ordination generated from a similarity matrix (using principal coordinates analysis), with the minimum spanning tree superimposed.
- After you have imported your data, from the menu select
Graphics | Multivariate | Minimum Spanning Tree. - Fill in the fields as required then click Run.
You can set additional options by clicking the Options and Frame tabs.
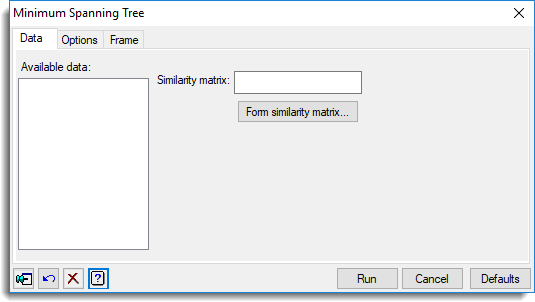
Available data
This lists data structures appropriate to the current input field. It lists symmetric matrices for specifying the data. Double-click a name to copy it to the current input field or type the name.
Similarity matrix
Specifies a symmetric matrix containing the data to be plotted. Select the name of the identifier for the data from the Available data list. You can double-click to copy the identifier names across or type the name.
Form similarity matrix
This opens a dialog which can be used to form a similarity matrix from variates and factors containing raw data.
Action buttons
| Run | Produce the graph. |
| Cancel | Close the dialog without further changes. |
| Defaults | Reset options to their default settings. |
Action Icons
| Pin | Controls whether to keep the dialog open when you click Run. When the pin is down |
|
| Restore | Restore names into edit fields and default settings. | |
| Clear | Clear all fields and list boxes. | |
| Help | Open the Help topic for this dialog. |
See also
- Minimum Spanning Tree options menu
- Frame options
- Form similarity matrix menu
- The DMST procedure in command mode which has more general input parameters and additional control over the graph