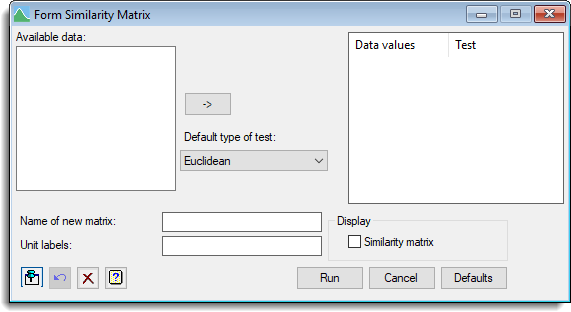
Select menu: Data | Form Similarity Matrix
This dialog forms a similarity matrix from a set of variables (variates or factors). The similarity coefficient that is calculated allows variables to be qualitative, quantitative or dichotomous, or mixtures of these types; values of some of the variables may be missing for some samples. The values of a similarity coefficient vary between zero and unity: two samples have a similarity of unity only when both have identical values for all variables; a value of zero occurs when the values for the two samples differ maximally for all variables.
- After you have imported your data, from the menu select
Data | Form Similarity Matrix.

Available data
This lists data structures appropriate to the current input field. The contents will change as you move from one field to the next. You can double-click a name to copy it to the current input field or type it in.
Data values
This specifies the variatbles (variates or factors) and the test type of each variable. The similarity test type of a variable determines how differences in variable values for each unit contribute to the overall similarity between units. Variates can be added to this list by double-clicking on a variable name within the Available data list. You can transfer multiple selections from Available data by holding the Ctrl key on your keyboard while selecting items, then click ![]() to move them all across in one action.
to move them all across in one action.
When a variable name is transferred from the Available data list the test type for the variable is set using the measure within the Default type of test list. The test type for a variable can be changed within the Data values list by double-clicking on the variable in this list and selecting a new similarity measure from the resulting dialog. You can also right click the list to get a pop-up menu (as shown below) to allow you to delete the Data values or modify the tests.

Similarity Measures
Jaccard is appropriate for dichotomous variables, simple matching for qualitative variables and the other settings give different ways for handling quantitative variables. The form of contribution to the similarity is as follows:
| Type | Contribution | Weight |
| Jaccard | if xi = xj = 1, then 1 | 1 |
| if xi = xj = 0, then 0 | 0 | |
| if xi /= xj, then 0 | 1 | |
| Simple matching | if xi = xj, then 1 | 1 |
| if xi /= xj, then 0 | 1 | |
| Dice | if xi = xj = 1, then 1 | 1 |
| if xi = xj = 0, then 0 | 0 | |
| if xi /= xj, then 0 | 0.5 | |
| Sneath and Sokal | if xi = xj, then 1 | 1 |
| if xi /= xj, then 0 | 0.5 | |
| Russell and Rao | if xi = xj, then 1 | 1 |
| if xi = 0 or xj = 0, then 0 | 1 | |
| Antidice | if xi = xj = 1, then 1 | 1 |
| if xi = xj = 0, then 0 | 0 | |
| if xi /= xj, then 0 | 2 | |
| Rogers and Tanimoto | if xi = xj, then 1 | 1 |
| if xi /= xj, then 0 | 2 | |
| Cityblock | 1 – |xi – xj| / range | 1 |
| Manhattan | synonymous with cityblock | |
| Ecological | 1 – |xi – xj| / range | 1 |
| unless xi = xj = 0 | 0 | |
| Euclidean | 1 – {(xi – xj) / range}2 | 1 |
| Pythagorean | synonymous with Euclidean | |
| Divergence | 1 – {(xi – xj) / (xi + xj)}2 | 1 |
| Canberra | 1 – |xi – xj| / (|xi| + |xj|) | 1/p |
| Bray and Curtis | 1 – |xi – xj| | xi + xj |
| Soergel | 1 – |xi – xj| | max(xi, xj) |
| Minkowski | 1 – |xi – xj|t/rt | 1 |
The Minkowski index t is given in the Minkowski index field which is only
visible when this type has been selected. Note only the Simple matching> type can be used with factors.
The measure of similarity is formed by multiplying each contribution by the corresponding weight, summing all these values, and then dividing by the sum of the weights.
Default type of test
This specifies the default similarity used when items are added to the Data values list. For example, when you double-click on a variable name within the Available data list to transfer it to the Data values list.
Name of new matrix
Specifies the name of the identifier of a symmetric matrix to save the similarity matrix.
Unit labels
Lets you specify a text or variate which is to be used to label the rows of the similarity matrix.
Display
Specifies which items of output are to be displayed in the Output window.
| Similarity matrix | A symmetric matrix of similarities . |
Action Icons
| Pin | Controls whether to keep the dialog open when you click Run. When the pin is down |
|
| Restore | Restore names into edit fields and default settings. | |
| Clear | Clear all fields and list boxes. | |
| Help | Open the Help topic for this dialog. |
See also
- K Nearest Neighbours menu.
- Hierarchical Cluster Analysis menu.
- Multivariate Analysis of Distance menu.
- FSIMILARITY directive for forming similarity matrices in command mode.