Select menu: Stats | Multivariate Analysis | Cluster Analysis | Hierarchical
Hierarchical cluster analysis starts by assigning the n data objects or samples to n separate clusters each containing one member. At each stage of the clustering, the two closest clusters are merged into one larger cluster, until finally all the units have been formed into a single cluster. This process can be represented by a hierarchical tree whose nodes indicate what merges have occurred.
- After you have imported your data, from the menu select
Stats | Multivariate Analysis | Cluster Analysis | Hierarchical.
OR
Stats | Data Mining | Cluster Analysis | Hierarchical. - Fill in the fields as required then click Run.
You can set additional Options then after running, you can save the results by clicking Save.
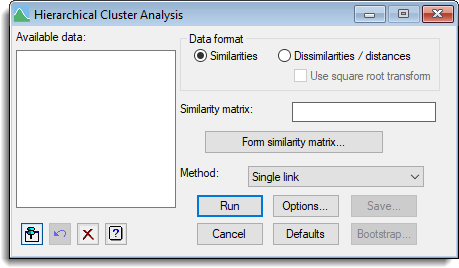
Available data
This lists similarity matrices that can be used as input for hierarchical cluster analysis.
Data format
| Similarities | The data is a symmetric matrix of similarities, where 1 indicates that two items are identical and 0 that two items share no similarities. The matrix will have ones down the leading diagonal as all items are identical to themselves and values between 0 and 1 for off diagonal elements |
| Dissimilarities / distances | The data is a symmetric matrix of dissimilarities or distances, where 0 indicates that two items are identical and the larger the value, the more dissimilar two items are. The matrix will have zeroes down the leading diagonal as all items are identical to themselves and non-negative values for off diagonal elements. The analysis will convert this matrix to similarities by scaling the dissimilarities by their maximum value and then subtracting this from 1, i.e. Similarity = 1 – Distance/MAX(Distance). If you need a different value than the maximum value for the scaling, you will need to use the Calculate menu to transform the dissimilarities to similarities. |
Use square root transform
For a Dissimilarities / distances matrix, the calculation of similarities will have an additional square root transform i.e. Similarity = SQRT(1 – Distance/MAX(Distance)). This may be appropriate if the matrix matrix is actually a squared distance matrix, or variance / sums of squares matrix.
Method
A number of methods for clustering are available and vary according to the way in which ‘closest’ is defined at each stage of merging groups. The following possibilities are available:
| Single link | Defines the similarity between two clusters as the maximum similarity between any two samples in those clusters |
| Nearest neighbour | Synonym for Single link |
| Complete link | Defines the similarity between two clusters as the minimum similarity between any two samples in those clusters |
| Furthest neighbour | Synonym for Complete link |
| Average link | Defines the similarity between a cluster and two merging clusters as the average of the similarities with each of the original clusters. It therefore replaces two merging clusters by their mean, unweighted by cluster size |
| Group average | An average is taken over all the samples in the two merging clusters. Thus, the original clusters are replaced by their mean, weighted by cluster size |
| Median sorting | Can be thought of in terms of clusters being represented by points in a multidimensional space; when two clusters join, the new cluster is represented by the midpoint of the original cluster points |
| Unweighted pair group method | The UPGMA method is a synonym of Average Link |
Similarity matrix
The data required for the hierarchical cluster analysis needs to be provided as a symmetric matrix giving the similarity between each pair of units.
Dissimilarity matrix
The data required for the hierarchical cluster analysis needs to be provided as a symmetric matrix giving the dissimilarity or distance between each pair of units.
Form similarity matrix
This produces a menu allowing you to form a similarity matrix from a set of variates (only when the Data format is Similarities).
Bootstrap
This opens the Bootstrap Hierarchical Cluster Analysis dialog so that the reliability of the clusters can be assesed.
Action Icons
| Pin | Controls whether to keep the dialog open when you click Run. When the pin is down |
|
| Restore | Restore names into edit fields and default settings. | |
| Clear | Clear all fields and list boxes. | |
| Help | Open the Help topic for this dialog. |
See also
- Options for choosing which results to display
- Saving Results for further analysis
- Bootstrap Hierarchical Cluster Analysis dialog
- Principal Coordinates Analysis for producing an ordination from the similarity matrix
- Principal Components Clustering menu.
- HCLUSTER procedure for hierarchical clustering
- DDENDROGRAM procedure for plotting dendrograms
- DMST procedure for plotting minimum spanning trees
- FSIMILARITY procedure for forming similarity matrices
- HBOOTSTRAP procedure for bootstrapping the cluster analysis cluster analysis