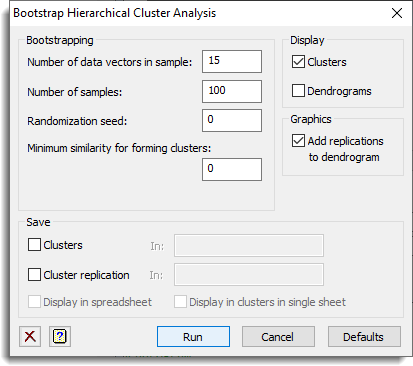
This menu selects the options used to produce a bootstrap analysis for a hierarchical clustering, so that the reliability of the clusters can be assessed. See the HBOOTSTRAP procedure for more details on the analysis.
Display
These options control what is displayed in the output window.
| Clusters | The clusters are generated from the bootstrap sampling and how often they occur. |
| Dendrograms | The dendrograms produced for each bootstrap sample. |
Number of data vectors in sample
Number of data vectors to take in each sample; by default this takes the same number as used in generating the similarity matrix.
Number of samples
The number of times to form bootstrap samples. This must be a positive integer.
Randomization seed
Seed for random number generator; if 0 is given, this continues from previous generation or uses the system clock to initialize the random number generator. The seed should be a non-negative integer.
Minimum similarity for forming clusters
Similarity value below which clusters are not recorded – this should be between 0 and 1.
Define similarity matrix
If the similarity matrix has not been formed by the Form Similarity Matrix menu, then this opens that menu, so that the variates and tests used to form the similarity matrix that can be defined.
Graphics – Add replications to dendrogram
If this is ticked, the replications of the clusters will be added to the dendrogram produced by the main menu. This will be disabled if no dendrogram has been produced. Select the Plot dendrogram option in Hierarchical Cluster Analysis Options dialog if this has not been plotted.
Save
Use this to save information from bootstrapping a hierarchical cluster analysis. As you check each box, you must specify the identifier of the data structure in which the results are to be saved.
| Clusters | Pointer | A pointer to variates giving the membership of each cluster. |
| Cluster replication | Variate | The number of times each cluster is obtained over the bootstrap samples. |
Display in spreadsheet
The saved results will be displayed in a new spreadsheet.
Display in clusters in a single sheet
If this is ticked, all the clusters membership variates will be made the same length, with missing values at the bottom for smaller clusters. Then they can all be displayed in a single spreadsheet, otherwise each size of cluster will occupy a separate page within a multi-sheet book.
See also
- Hierarchical Cluster Analysis menu
- Hierarchical Cluster Analysis Options for choosing which results to display
- Saving Results for further analysis
- Form Similarity Matrix menu
- HCLUSTER procedure for hierarchical clustering
- DDENDROGRAM procedure for plotting dendrograms
- DMST procedure for plotting minimum spanning trees
- FSIMILARITY procedure for forming similarity matrices
- HBOOTSTRAP procedure for bootstrapping the cluster analysis