Select menu: Graphics | Add to Graph | Arrow
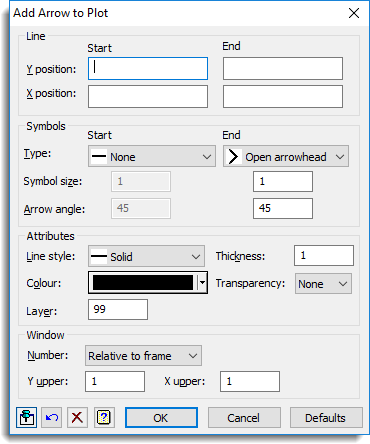
Use this to add arrows (or lines if the starting and ending styles are None) to an existing graph open in the graphics viewer.
- From the menu select Graphics | Add to Graph | Arrow.
Line
Use these fields to specify where the lines start and finish. You can enter these as numbers, a list of numbers separated by spaces or commas or type name of a variate or scalar structure that exists in Genstat. If you supply lists of numbers or variates these must match in length.
Y and X starting and ending positions
Lets you specify where the arrows start and finish. You can enter these as numbers, a list of numbers separated by spaces or commas or type name of a variate or scalar structure that exists in Genstat. If you supply lists of numbers or variates these must match in length.
Style
Lets you specify the style at the start and end of the arrow.
| Open arrowhead | Places an open arrowhead at the start or end of the line |
| Closed arrowhead | Places a filled arrowhead at the start or end of the line |
| Circle | Places a filled circle at the start or end of the line |
| None | No symbols are used at the start or end of the line |
Symbol size
Specifies the size of the symbol used at each end of the line. The value 1 gives the standard symbol size.
Arrow angle
Specifies the angle (in degrees) of the arrow heads. Setting the angle to a value greater than 180 (e.g. 315) reverses the direction of the arrowhead. The angle must be between 0 and 360.
Line style
Lets you select from a list of line styles.
Thickness
Specifies an amount by which to multiply the standard thickness of the plotted lines. The value 1 represents the standard thickness.
Colour
Lets you select the colour of the line and symbols.
Transparency
This lets you specify the transparency of the arrow. Selecting None means nothing will show through the arrow. Otherwise, the larger the value of transparency, the more the existing graph will show through the arrow.
Layer
Specify the layer in which the arrow heads are plotted. A large value will force arrows to overlie previous layers in the plot, and values less than existing layers will display arrows below these in the plot.
Window number
Defines the window where the arrows are to be added. If you select Relative to frame the Y and X positions are relative to the frame (whose maximum X and Y limits are provided in the Y upper and X upper fields). For example, if the X and Y upper boundaries are 1, then a value of 0.5 for the starting X and Y positions will position the start of the arrow at the centre of the graph. If a window number is used, the starting and ending Y and X positions are relative to the data currently displayed in that graph.
Action buttons
| Run | Add the arrow to the plot. |
| Cancel | Close the dialog without further changes. |
| Defaults | Reset options to their default settings. |
Action Icons
| Pin | Controls whether to keep the dialog open when you click Run. When the pin is down |
|
| Restore | Restore names into edit fields and default settings. | |
| Clear | Clear all fields and list boxes. | |
| Help | Open the Help topic for this dialog. |
See also
- Add Text to Plot dialog
- Add Reference Line to Plot dialog
- Create Graph
- Add Error Bar to Plot
- Graphics Menu
- DARROW procedure