Select menu: Graphics | Add to Graph | Text
Use this to add some text to an existing graph open in the graphics viewer.
- From the main menu select Graphics | Add to Graph | Text.
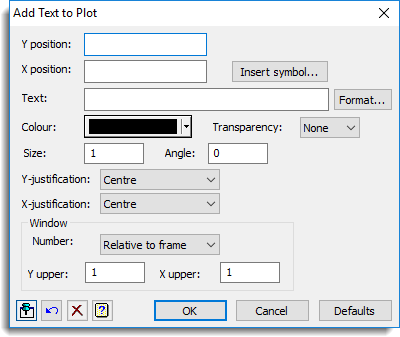
Y and X positions
Specifies the position where the text is placed. This can be a number, a list of numbers separated by spaces or commas, or a variate or scalar. The lengths of the Y and X variates or lists of numbers must be the same. If the Window is set to Relative to frame, the position is given in frame coordinates, rather than graph coordinates. Frame coordinates can be used to plot text outside the graph box containing the data.
Text
Specifies the text to be placed in the graph. If more than one line of one text is to be inserted, you can specify a list of strings separated by spaces or commas, or a text structure containing several lines. The number of lines of text should be the same as the number of Y positions. Strings that contain spaces or commas must be contained in single quotes (e.g. ‘Group 1’, ‘Group 2’). If you need to use a quote in a quoted text, this should be doubled (e.g. ‘tomorrow”s location’).
Insert symbol
This opens the Insert Symbol dialog where you can add Greek and mathematical symbols or line breaks into the Text field.
Format
This opens the Format Text dialog where you can format text (bold, italic, subscript, superscript) in the Text field. If only part of the text is selected, only that selection will be formatted or replaced.
Colour
Select the text colour that you want to use .
Transparency
Specifies the transparency of the text. Selecting None means nothing will show through the text. Otherwise, the larger the value of transparency, the more the existing graph will show through the text.
Size
Specifies an amount by which the standard size of the text is to be multiplied by. The value 1 represents the standard size.
Angle
Specifies the angle of the text. An angle of 0 places the text horizontally, 90 places the text vertically and 180 flips the text so that it appears upside down.
Y-justification
Specifies how the text is placed relative to the Y position.
| Below | Places the label above the Y position |
| Centre | Centres the label around the Y position |
| Above | Places the label below the Y position |
X-justification
Specifies how the text is placed relative to the X position.
| Left | The label is placed to the left of the X position |
| Centre | The label is centred around the X position |
| Right | The label is placed to the right of the X position |
Window number
Specifies the window where the text is to be added. If you select Relative to frame the Y and X positions are relative to the frame (whose maximum X and Y limits are provided in the Y upper and X upper fields). For example, if the X and Y upper boundaries are 1, then a value of 0.5 for the X and Y positions will position the text at the centre of the graph. If a window number is used, the Y and X positions are relative to the data currently displayed in that graph.
Action buttons
| Run | Add the text to the graph. |
| Cancel | Close the dialog without further changes. |
| Defaults | Reset options to their default settings. |
Action Icons
| Pin | Controls whether to keep the dialog open when you click Run. When the pin is down |
|
| Restore | Restore names into edit fields and default settings. | |
| Clear | Clear all fields and list boxes. | |
| Help | Open the Help topic for this dialog. |
See also
- Insert Symbol dialog
- Format Text dialog
- Add Reference Line to Plot
- Add Arrow to Plot
- Add Error Bar to Plot
- Create Graph
- Graphics Menu
- DTEXT procedure
- DFRTEXT procedure