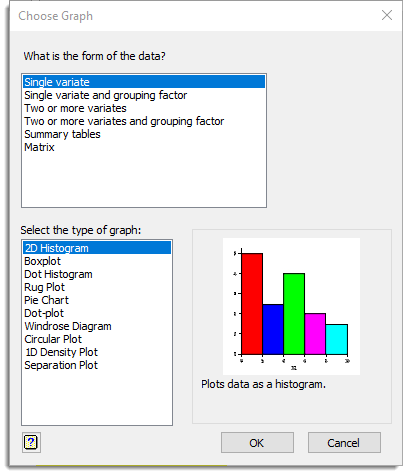
This provides help in choosing a graph appropriate for the type of data structures that you have. A list of typical categories that describe the form your data structures may represent is displayed. By selecting one of the categories a list of possible graph types for that type of data is produced. You can then select from the list of graphs to open a menu where you can enter your data.
- From the menu select Graphics | Create Graph.

What is the form of the data?
This provides a list of typical categories that describe the form your data structures may represent. When you select an item a list of possible graph types for that type of data is displayed.
Select the type of graph
This displays the graph types available for the chosen form of data category. Choose the type of graph you wish to use and click OK to open a menu where you can enter your data.
See also
- 2D Scatter Plot
- 2D Line Plot
- 3D Scatter Plot
- 2D Density Plot
- 2D Groups Plot
- Confidence Region Plot
- Histogram
- Bar Chart
- Mosaic Plot
- Plot Table
- Boxplot
- Dot Histogram
- Dot Plot
- Bland-Altman Plot
- Rug Plot
- Pie Chart
- Stem and Leaf
- 1D Density Plot
- Contour Plot
- Surface Plot
- Shade Plot
- Image Plot
- 3D Histogram
- Scatter Plot Matrix
- Trellis Plot
- Repeated Measures Profile Plot
- Biplot
- Minimum Spanning Tree
- Probability Plot
- Lorenz Curve
- Species Abundance Plot
- Species Accumulation Curves
- Windrose Diagram
- Circular Plot
- Polar Plot
- Separation Plot