Select menu: Graphics | Dot-plot
Use this to specify data for a dotplot.
- After you have imported your data, from the menu select
Graphics | Dot-Plot. - Fill in the fields as required then click Run.
You can set additional options and axis settings by clicking the Options, X Axis and Frame tabs.
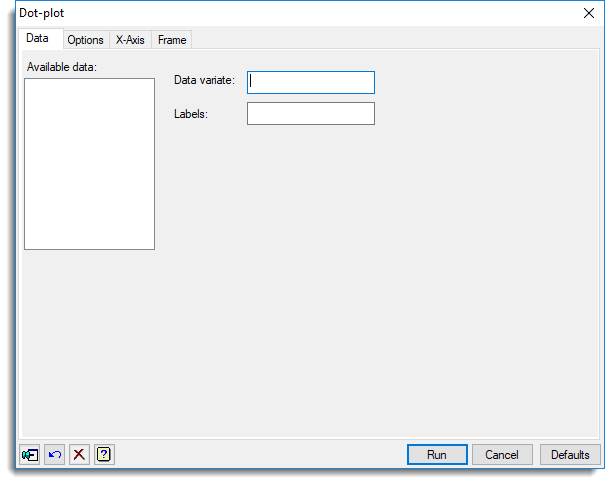
Data variate
Specifies the data to be plotted. Double-click the name of the identifier for the data in the Available data field or type the name.
Labels
Use this to specify a text indicating the labels for different groupings of data.
See also
- Dot Plot – options menu
- DOTPLOT procedure