Use this to set attributes to control the appearance of the Dot Plot.
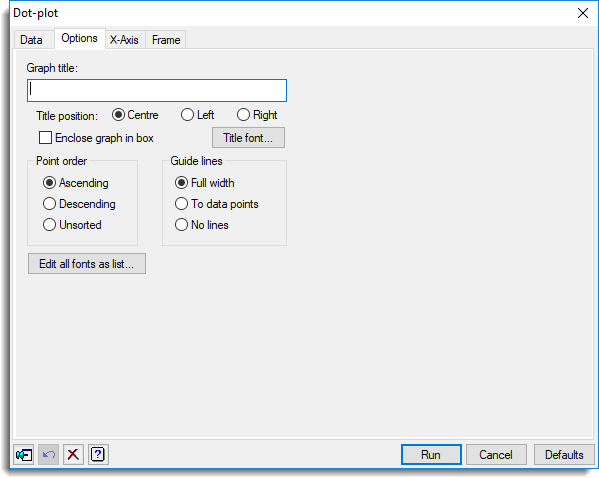
Graph title
Lets you enter a title for the graph. The title appears centred at the top of the graph.
Title position
You can position the title by selecting the Centre, Left or Right option.
Enclose graph in box
Select this to draw an enclosing box around the graph.
Title font
This opens the Edit Font dialog that lets you control the font for the title.
Point order
Controls whether the x-values are to be sorted. You can sort the values into ascending or descending order by selecting the appropriate option. If you do not want the values to be sorted select Unsorted.
Guide lines
Controls how the guide lines are drawn on the plot. Select Full width if you want guide lines to appear across the full width of the plot for each data point. Alternatively, you can select To data points if you want the guide lines to appear just to the data points. If you do not want any guide lines to be drawn select No lines.
Edit all fonts as a list
Clicking this opens the Edit All Fonts as a List dialog which allows all the fonts in the graph to be set in one place.
Action buttons
| Run | Produce the graph. |
| Cancel | Close the dialog without further changes. |
| Defaults | Reset options to their default settings. |
Action Icons
| Pin | Controls whether to keep the dialog open when you click Run. When the pin is down |
|
| Restore | Restore names into edit fields and default settings. | |
| Clear | Clear all fields and list boxes. | |
| Help | Open the Help topic for this dialog. |
See also
- Dot Plot – data menu
- Edit font dialog
- Edit All Fonts as a List
- DOTPLOT procedure